
Flowchart Quiz
How the Scales are Structured
Who Usually Takes This Test?
See How You Compare
Below is a preview of how scores are typically distributed across each scale.
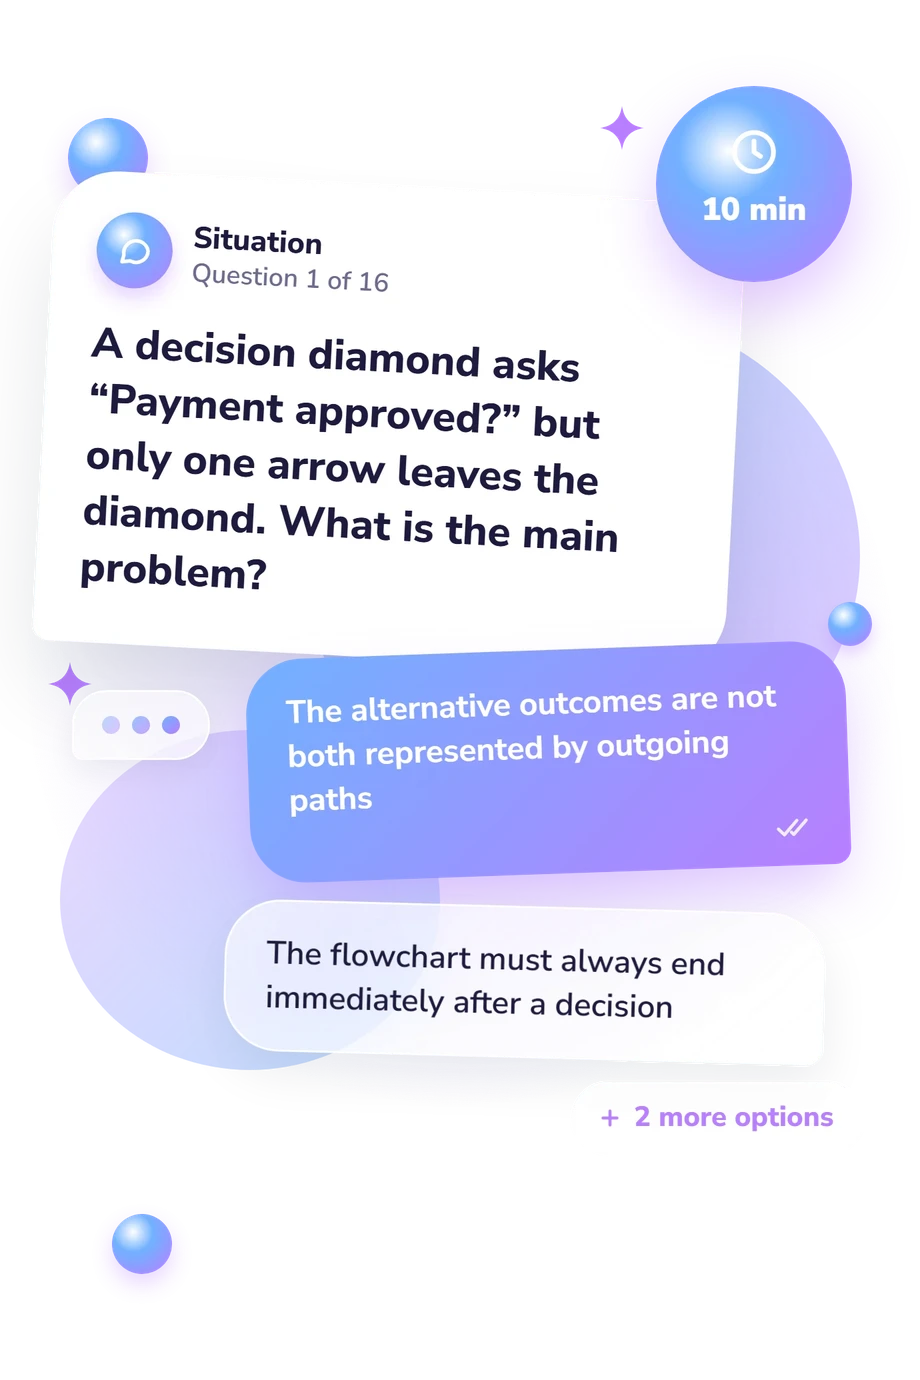
Example Questions From the Test
- A rounded terminator symbol
- A process rectangle
- A document symbol with a wavy base
- An on-page connector circle
- The amount of data stored at each step
- The direction in which control moves between steps
- The person responsible for each task
- The difficulty of each operation
- To show the steps and control flow of an algorithm visually
- To execute an algorithm directly without program code
- To record only the inputs and outputs of an algorithm
- To measure how long a completed program takes to run
Flowchart Quiz - Description and methodology of the test
Learners revisiting programming fundamentals can use this flowchart quiz to identify where focused revision will be most useful. Its result can guide the next study step by showing whether core visual reasoning feels secure or needs more practice. Because it is a flow chart quiz, the assessment fits quick, self-directed study.
What This Assessment Measures
Questions assess practical flowchart literacy: symbol recognition, arrow direction, decisions, variable tracing, loops, and clarity of structure. The test suits learners checking programming fundamentals, but it does not attempt to measure overall coding ability. A flowchart test can show which kinds of visual reasoning deserve more practice.
The single reported scale is Flowchart Knowledge (0-16): Foundation (0-6), Developing (7-12), and Strong (13-16). The band indicates how accurately the respondent handled the tested conventions and scenarios.
The result draws on four related areas:
- Symbols show whether standard shapes and connectors are recognized correctly.
- Control flow shows whether branches and execution direction are followed accurately.
- Loop tracing shows whether repeated steps and stopping conditions are understood.
- Algorithm clarity shows whether structures are organized and maintainable.
Methodology and Evidence Base
Each item presents a short flowchart situation or convention question with four answer choices. Solving it may require recognizing a symbol, following a branch, tracing a loop, or predicting an output. As a flowchart assessment, the questionnaire reports one overall score rather than separate results for symbols, decisions, and loops.
Its conventions are conceptually consistent with ISO 5807 and with the structured-programming work of Nassi and Shneiderman, which addresses sequence, selection, and repetition. It is an online knowledge check, not an adaptation of either publication. Research by Shneiderman, Mayer, McKay, and Heller examined the usefulness of detailed flowcharts in programming tasks, but does not establish reliability or validity for this questionnaire.
Interpret the band as performance on the selected items, not as a population norm or a complete measure of programming ability. Results may vary with prior instruction, familiarity with formal notation, attention, and guessing. Reviewing the underlying topics can make the score more useful than treating the label as a fixed ability level.
- International Organization for Standardization. ISO 5807:1985. Information processing - Documentation symbols and conventions for data, program and system flowcharts, program network charts and system resources charts. Geneva: International Organization for Standardization; 1985.
- Nassi, I., and Shneiderman, B. Flowchart techniques for structured programming. ACM SIGPLAN Notices. 1973;8(8):12-26. 10.1145/953349.953350
- Shneiderman, B., Mayer, R. E., McKay, D., and Heller, P. Experimental investigations of the utility of detailed flowcharts in programming. Communications of the ACM. 1977;20(6):373-381. 10.1145/359605.359610
Updated: