
IR Quiz
How the Scales are Structured
Who Usually Takes This Test?
See How You Compare
Below is a preview of how scores are typically distributed across each scale.
Example Questions From the Test
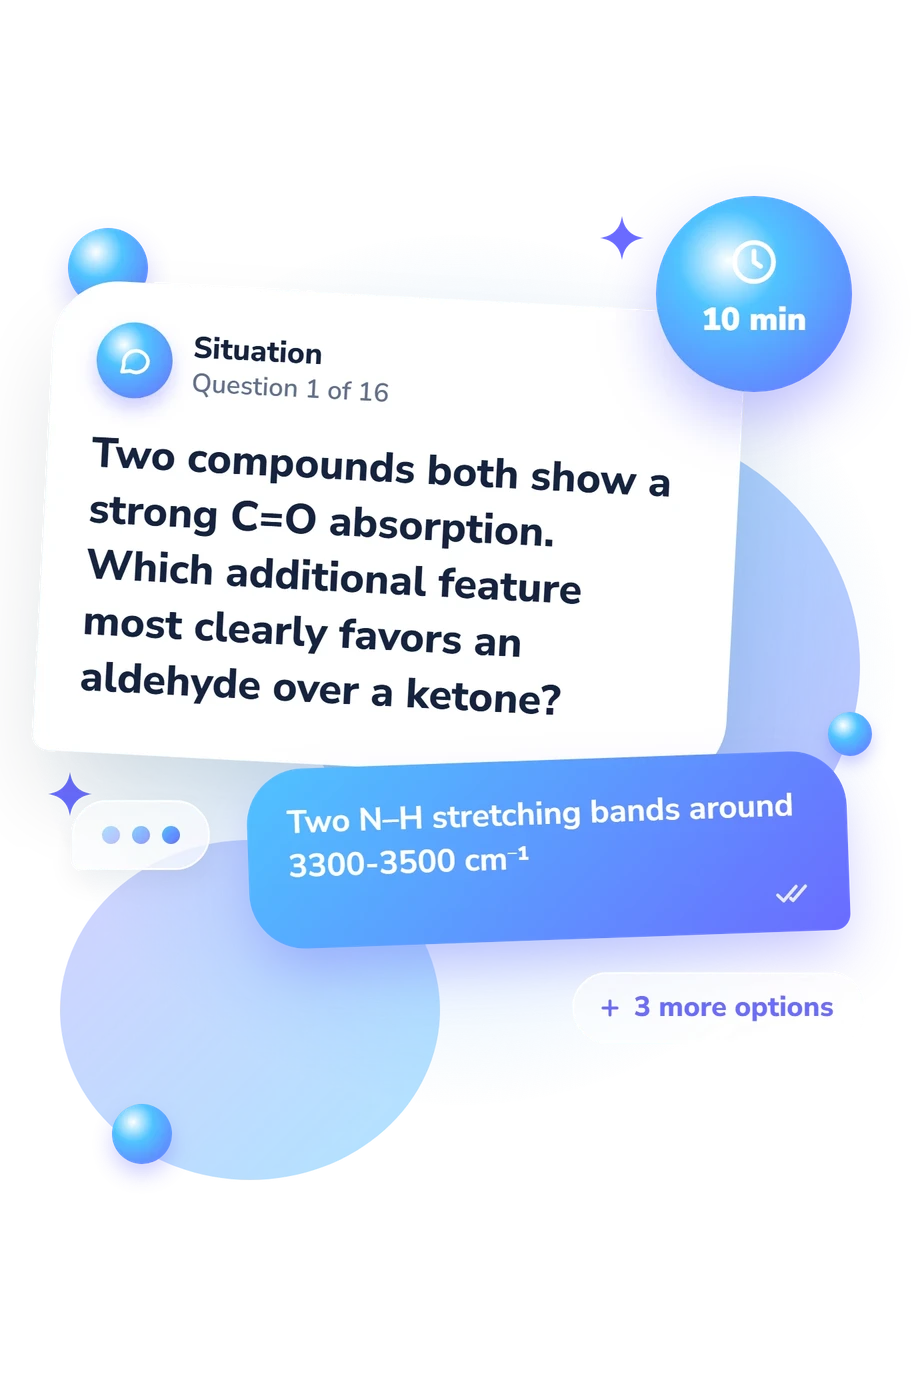
- Two N–H stretching bands around 3300-3500 cm⁻¹
- A broad O–H band extending from about 2500 to 3300 cm⁻¹
- A sharp C≡N band near 2250 cm⁻¹
- One or two weak aldehydic C–H bands near 2720 and 2820 cm⁻¹
- Tertiary amine
- Primary amine
- Alcohol
- Secondary amine
- Alcohol
- Ketone carbonyl
- Nitrile
- Primary amine
IR Quiz - Description and methodology of the test
Students reviewing functional-group recognition, spectral clues, or laboratory interpretation can use this assessment to check what they already understand. The IR Quiz focuses on reading common absorptions and connecting them with likely structural features rather than memorizing isolated numbers. It also works as an infrared spectroscopy quiz for deciding whether review should begin with foundational ranges, comparisons, or subtler diagnostic patterns.
What This Assessment Explores
Questions test practical reading of infrared spectra: recognizing characteristic absorptions, combining clues, noticing missing bands, and separating plausible functional groups from alternatives. The audience includes students, laboratory trainees, and independent learners who want an applied check of chemistry knowledge.
Coverage includes carbonyls, alcohols, amines, nitriles, alkynes, aromatic systems, hydrocarbons, conjugation, contamination, ATR, and fingerprint comparison. This IR spectroscopy practice quiz can show which evidence deserves more review.
The result uses one scale, IR Spectroscopy Knowledge (0-16), divided into these bands:
- Foundations to Review (0-6) marks a need to revisit characteristic ranges and peak combinations.
- Developing Interpreter (7-12) indicates useful command of common groups, with subtler comparisons still developing.
- Strong IR Knowledge (13-16) reflects consistent links among diagnostic absorptions, missing peaks, and likely structures, while remaining educational rather than proof of identity.
Methodology and Scientific Basis
Methodologically, this is a selected-response educational assessment. Each item presents a situation with four answer choices, so performance depends on choosing the best interpretation rather than writing a structure. The set mixes direct band recognition with reasoning from absences, frequency shifts, sample handling, and fingerprint patterns.
The questionnaire reports one total score but provides no item-weighting rule; the bands are therefore educational descriptors, not a reconstructed formula. Reviewing missed items against peak position, breadth, intensity, and neighboring absorptions makes practice with IR spectra more useful than the number alone.
Chemically, the framework is consistent with Silverstein et al. (2014), with complementary treatment in Pavia et al. (2015) and reference spectra in the NIST Chemistry WebBook. These sources support interpretation involving functional-group regions, dipole-moment changes, conjugation, ATR, and fingerprint comparison, but this questionnaire is not an adaptation of any one published instrument.
These bands are educational descriptors rather than population norms, and performance may vary with memorization, recent study, and uncertainty when applying spectral evidence to unfamiliar sample patterns; laboratory identification still requires the full spectrum and supporting data.
- Silverstein, Robert M.; Webster, Francis X.; Kiemle, David J.; Bryce, David L. Spectrometric Identification of Organic Compounds, 8th ed. Wiley, 2015.
- Pavia, Donald L.; Lampman, Gary M.; Kriz, George S.; Vyvyan, James R. Introduction to Spectroscopy, 5th ed. Cengage Learning, 2014.
- Linstrom, Peter J.; Mallard, W. Gary, eds. NIST Chemistry WebBook, NIST Standard Reference Database Number 69. National Institute of Standards and Technology, 2025. 10.18434/T4D303
Updated: