
Freudly+971 508685814hello@freudly.ai
Freudly
arrange

PTSD Stressfulness Rating Scale Test
Take the online PTSD Stressfulness Rating Scale Test - AI psychologist FreudlyYou can take PTSD Stressfulness Rating Scale Testhere. Online version of a simple and accurate psychological test with interpretation.en
Understand which manufacturing or sales situations feel most stressful in about 7 minutes. Get clear, actionable insights to reduce strain, support well-being, and improve performance.
Start Online Test
Questions: 367 minutes
08:30
October 2, 2025
October 2, 2025
Material has been updated
October 2, 2025
Material has been published
29,842 views
2,184 completions
1,820 likes
Verified by Daniel Hall
Psychologist with 25 years of experience
Share
Scale Explorer

How the Scales are Structured

example score
10/42
Challenge Situation (CS)
Measures how stressful work situations feel when they demand substantial effort to overcome (e.g., urgent problems, conflicts, or technical issues).
Low stress
Moderate stress
High stress
617: Low stress | 1829: Moderate stress | 3042: High stress
A score of 10 falls in the Low stress range, suggesting challenge situations are currently perceived as relatively manageable and not strongly strain-inducing.
example score
25/42
Threat of Loss Situation (ToLS)
Measures how strongly you experience stress in work situations involving a potential loss (e.g., resources, status, or results).
Low sensitivity
Moderate sensitivity
High sensitivity
617: Low sensitivity | 1829: Moderate sensitivity | 3042: High sensitivity
A score of 25 falls in the Moderate sensitivity range, suggesting a noticeable but not extreme stress response to situations where losses may occur.
example score
30/42
Loss Situation (LS)
Measures how stressful situations involving loss of time, resources, or material assets feel to the individual at work.
Low
Moderate
High
617: Low | 1829: Moderate | 3042: High
A score of 30 falls in the High range, indicating that loss-related events are associated with a marked level of perceived stress for this person.
example score
19/42
Uncertainty (U)
Measures how unpredictable and open-ended a work situation feels, affecting how easily outcomes can be anticipated.
Low uncertainty
Moderate uncertainty
High uncertainty
617: Low uncertainty | 1829: Moderate uncertainty | 3042: High uncertainty
A score of 19 indicates moderate uncertainty, suggesting situations are sometimes hard to forecast but still have some predictable structure.
example score
23/42
Productivity (P)
This scale measures the internal resources a person can draw on to cope effectively with work-related stressors.
Low resources
Moderate resources
High resources
617: Low resources | 1830: Moderate resources | 3142: High resources
A score of 23 falls in the Moderate resources range, suggesting a fair capacity to manage stressful situations with some variability depending on the demands.
example score
28/42
Uncontrollability (U)
Measures how uncertain a person feels about having enough control and resources to manage stressful work situations.
Low uncontrollability
Moderate uncontrollability
High uncontrollability
617: Low uncontrollability | 1829: Moderate uncontrollability | 3042: High uncontrollability
A score of 28 indicates moderate uncontrollability, suggesting a notable but not extreme sense that the situation may be hard to influence or manage.
example score
29/42
Personal Significance (PS)
Measures how important a work situation is perceived to be for the individual’s future.
Low significance
Moderate significance
High significance
617: Low significance | 1829: Moderate significance | 3042: High significance
A score of 29 indicates the situation is viewed as moderately significant, suggesting it matters to future outcomes but is not experienced as highly pivotal.
example score
30/42
Emotional Tension (ET)
This scale measures how much emotional strain a person feels and how limited their internal coping resources seem in stressful work situations.
Low tension
Moderate tension
High tension
617: Low tension | 1829: Moderate tension | 3042: High tension
A score of 30 indicates high emotional tension, suggesting the situation is experienced as strongly taxing with fewer perceived coping resources available.
example score
33/42
Recurrence (R)
Measures how frequently stressful work situations recur over time.
Low repetition
Moderate repetition
High repetition
617: Low repetition | 1829: Moderate repetition | 3042: High repetition
A score of 33 indicates high repetition, suggesting stressful situations are occurring frequently and may accumulate impact over time.
example score
13/42
Overall Stressfulness Index (OSI)
Measures the average perceived stressfulness of typical workplace situations to indicate overall vulnerability versus resilience to stress.
Low stress sensitivity
Moderate stress sensitivity
High stress sensitivity
617: Low stress sensitivity | 1829: Moderate stress sensitivity | 3042: High stress sensitivity
A score of 13 falls in the Low stress sensitivity range, suggesting you generally perceive common work situations as less stressful than most.
Start Online Test
just completed the test
DATA-BASED USER COHORTS

Who Usually Takes This Test?

Shop Floor Employees
41%OF USERS
Operators, technicians, and line workers take it to pinpoint which daily production pressures, safety demands, and technical issues trigger the most stress.
Sales and Account Staff
34%OF USERS
Sales reps and account managers use it to rate how deadlines, customer conflict, targets, and constant communication affect their stress levels.
Team Leads and HR
25%OF USERS
Supervisors, HR, and workplace psychologists take it to map team stress hotspots and decide where to adjust workload, processes, or support.
BASED ON AGGREGATED, ANONYMIZED DATA FROM TENS OF THOUSANDS OF FREUDLY USERS.
Benchmarking

See How You Compare

Once you complete the test, your results are compared with real-world data from people in your country.
Below is a preview of how scores are typically distributed across each scale.
The “call” situation (T“s)
Average
17.3
Normal range
11.423.2
min.
6
max.
42
This curve shows how scores are typically distributed.
Once you complete the test, your result will appear on the scale so you can see how you compare.
"Threat of Loss" Situation ("oLS)
Average
26.6
Normal range
2033.2
min.
6
max.
42
This curve shows how scores are typically distributed.
Once you complete the test, your result will appear on the scale so you can see how you compare.
The "Loss" Situation (T"S)
Average
19.1
Normal range
14.423.8
min.
6
max.
42
This curve shows how scores are typically distributed.
Once you complete the test, your result will appear on the scale so you can see how you compare.
Uncertainty (U)
Uncertainty (U)
Average
22.6
Normal range
16.328.9
min.
6
max.
42
This curve shows how scores are typically distributed.
Once you complete the test, your result will appear on the scale so you can see how you compare.
Productivity (P)
Productivity (P)
Average
27.6
Normal range
22.133.2
min.
6
max.
42
This curve shows how scores are typically distributed.
Once you complete the test, your result will appear on the scale so you can see how you compare.
Uncontrollability (U)
Average
19.4
Normal range
14.224.6
min.
6
max.
42
This curve shows how scores are typically distributed.
Once you complete the test, your result will appear on the scale so you can see how you compare.
Personal significance (Ps)
Average
32
Normal range
27.536.6
min.
6
max.
42
This curve shows how scores are typically distributed.
Once you complete the test, your result will appear on the scale so you can see how you compare.
Emotional tension (Et)
Average
20.9
Normal range
15.925.9
min.
6
max.
42
This curve shows how scores are typically distributed.
Once you complete the test, your result will appear on the scale so you can see how you compare.
Repetitiveness (R)
Repetitiveness (R)
Average
16.1
Normal range
11.320.8
min.
6
max.
42
This curve shows how scores are typically distributed.
Once you complete the test, your result will appear on the scale so you can see how you compare.
Overall Stress Index (OSI)
Average
26.5
Normal range
20.532.4
min.
6
max.
42
This curve shows how scores are typically distributed.
Once you complete the test, your result will appear on the scale so you can see how you compare.
Featured On
SAMPLE QUESTIONS

Example Questions From the Test

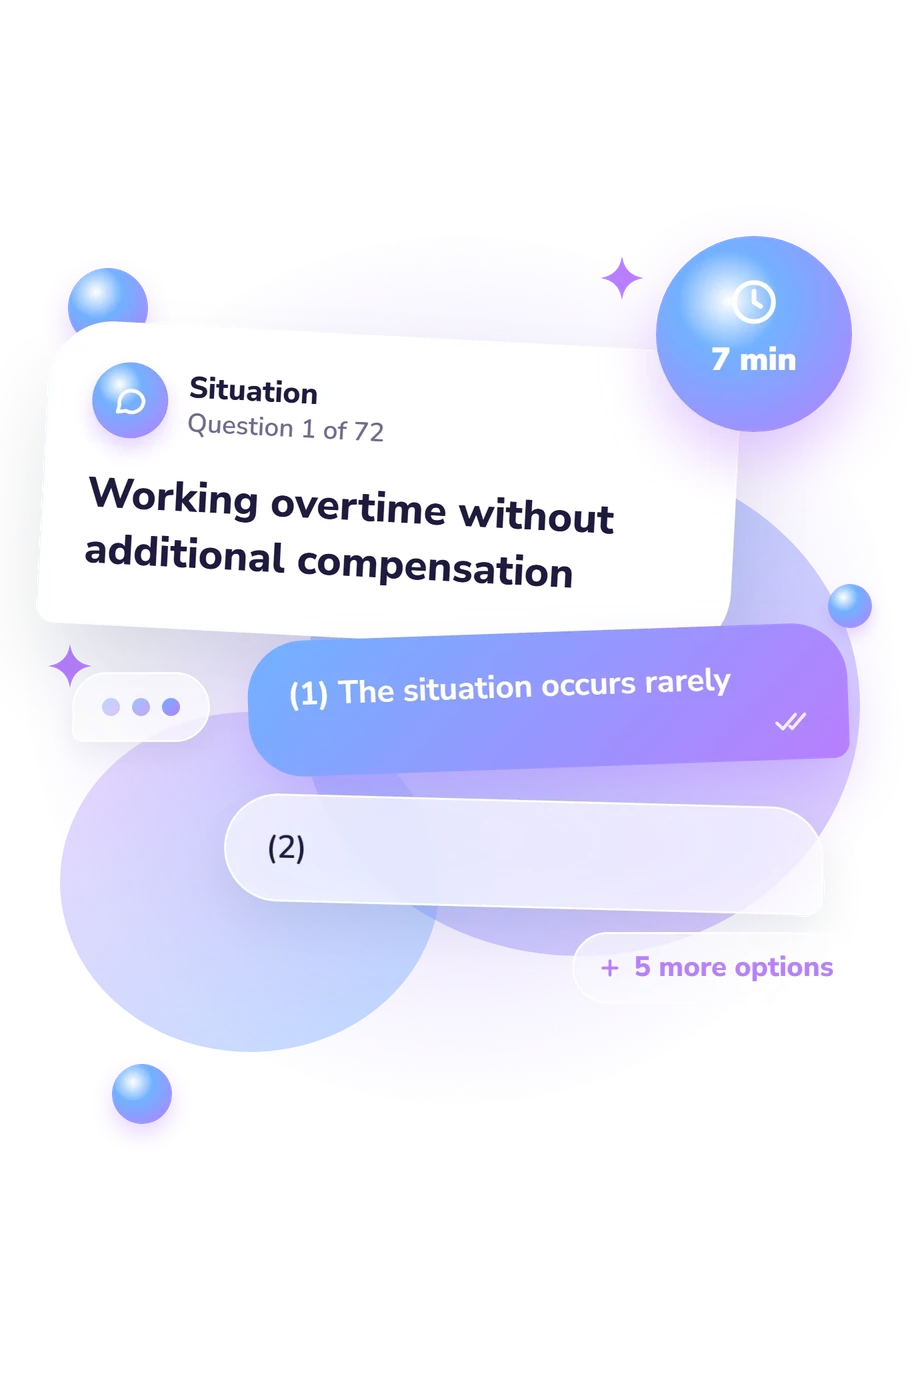
You will be presented with several professionally challenging work-related situations and rating scales to assess your experiences, described by two opposite endpoints. There are no “good” or “bad” answers; responses reflect individual differences in how people react. Please indicate the extent to which your personal experiences or attitudes apply to the situations listed below.
    • (1) The situation occurs rarely
    • (2)
    • (3)
    • (4)
    • (5)
    • (6)
    • (7) The situation occurs often
    • (1) I feel calm
    • (2)
    • (3)
    • (4)
    • (5)
    • (6)
    • (7) I feel treated unfairly and irritated
    • (1) The situation occurs rarely
    • (2)
    • (3)
    • (4)
    • (5)
    • (6)
    • (7) The situation occurs frequently
WHAT THE TEST MEASURES
About This Assessment
PTS Stressfulness Rating Scale Test

PTSD Stressfulness Rating Scale Test - Symptoms and Signs

arrange
work stress

In occupational and organizational settings, clinicians may use the PTSD Stressfulness Rating Scale to quantify how stressful common work situations are perceived to be. Developed by Edna B. Foa, it supports structured appraisal of stress-provoking events relevant to routine professional demands.

The measure consists of 36 items and typically requires about 7 minutes to complete. Respondents rate the stressfulness of a range of potential workplace stressors (e.g., time pressure, interpersonal friction, operational disruptions). Scores can help identify the situations associated with the highest perceived strain, informing targeted intervention planning, consultation, and monitoring; the PTSD Stressfulness Rating Scale is not a stand-alone diagnostic instrument.

Author: Edna B. Foa
Literature: Lazarus, R. S., & Folkman, S. Stress, appraisal, and coping. Springer. 1984.
Popular tests
Comments
Leave a Comment