
Social Exclusion Experience Scale Test
How the Scales are Structured
Who Usually Takes This Test?
See How You Compare
Below is a preview of how scores are typically distributed across each scale.
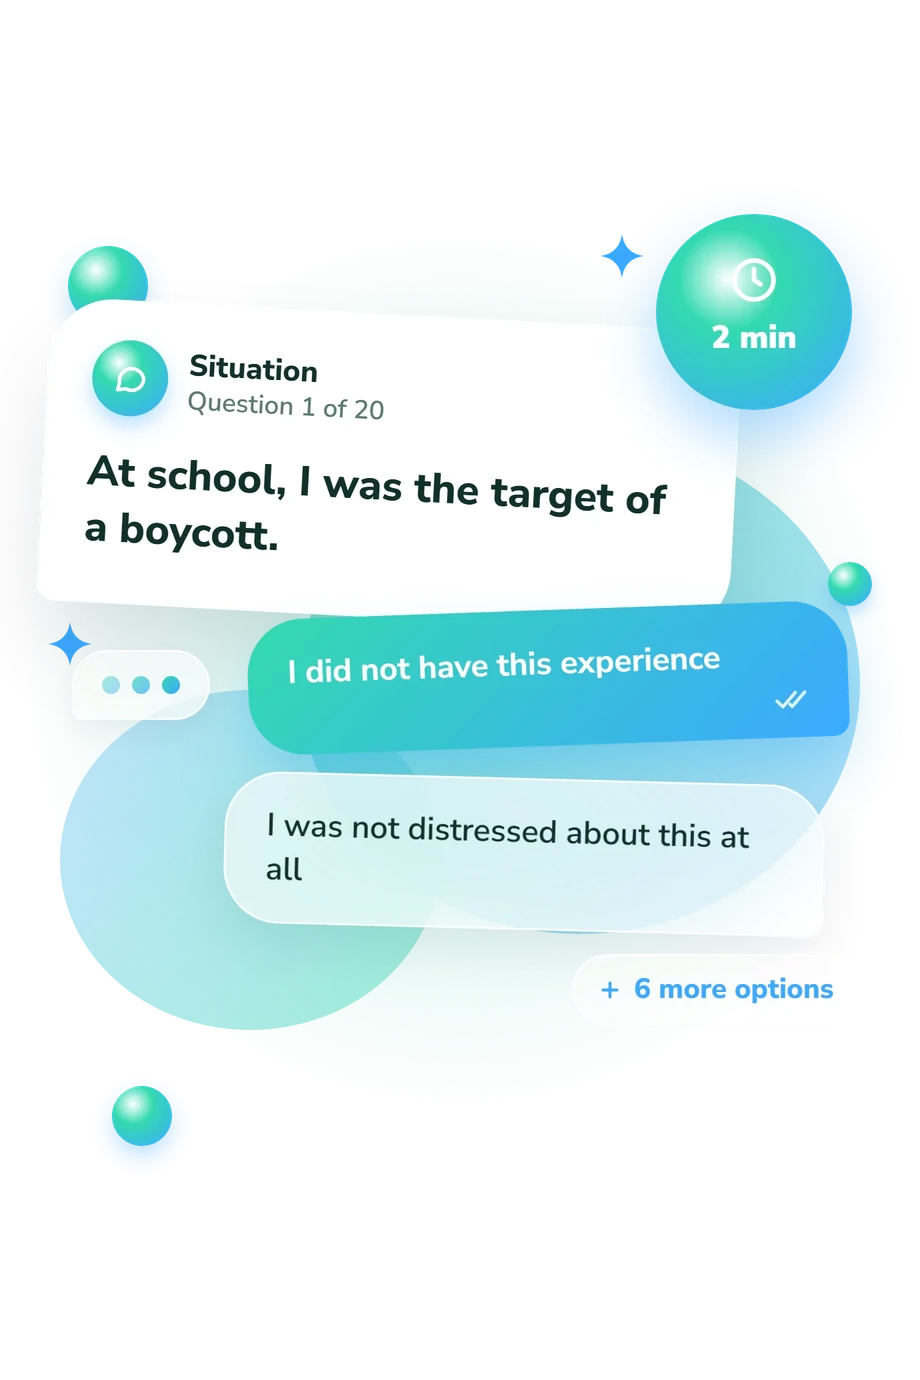
Example Questions From the Test
- I did not have this experience
- Not at all distressed by this
- Hardly distressed
- Probably not distressed
- Not sure
- Probably distressed
- Quite distressed
- Very distressed by this
- I have not had this experience
- I did not feel any distress about this
- I felt little distress
- I felt rather not distressed
- Hard to say
- I felt somewhat distressed
- I felt quite distressed
- I felt extremely distressed about this
- I did not have this experience
- I was not distressed at all by this
- I was hardly distressed
- I was rather not distressed
- Hard to say
- I was somewhat distressed
- I was quite distressed
- I was very distressed by this
Social Exclusion Experience Scale Test - Description and methodology of the test
People who are trying to understand repeated experiences of being ignored, rejected, bullied, or pushed outside a group may use the Social Exclusion Experience Scale Test for structured self-reflection. It considers how exclusionary situations affect valued relationships, school experiences, and contact with influential people. Its profile highlights social exclusion patterns linked with stronger perceived distress without reducing a complex personal history to one label.
What This Assessment Explores
Items cover school treatment, valued relationships, and higher-status rejection, showing whether experiences cluster or span settings.
The result organises themes into three displayed contextual scales and one overall index:
- Exclusion by High-Status Figures (0-21) measures exclusion or rejection by significant or high-status figures in broader social settings; higher scores may indicate more frequent isolation initiated by them; Low 0-10, High 11-21.
- Rejection in a Dyad (0-21) measures rejection, betrayal, or sudden cutoff in dyadic relationships; Low 0-17, High 18-21.
- School Bullying (0-28) measures bullying, ridicule, ostracism, and appearance-based mistreatment; Low 0-18, High 19-28.
- Social Exclusion Experience Index (0-70) combines bullying, dyadic rejection, and exclusion by higher-status figures, reflecting the overall sense of social exclusion, alienation, and related discomfort; Low distress 0-41, High distress 42-70.
The profile shows where distress is greater and how experiences vary across contexts.
Methodology and Scientific Basis
Each item describes a social situation and offers eight responses. Options begin with no experience, continue through low distress, place the hard-to-say response in the middle, and end with higher distress choices. The format keeps event and emotional impact together, so the selected response reflects both exposure and reported reaction rather than occurrence alone.
The questionnaire groups answers by context and combines them in the index, allowing experiences of social isolation to be considered together. Listed ranges and bands provide the interpretation framework; response choices do not justify adding undocumented weights or treating bands as clinical cutoffs.
The questionnaire is conceptually consistent with Experiencing Social Exclusion (ESE), described in 2022 by Semenova and colleagues, and can be read alongside Suvorova’s 2016 trial questionnaire. Williams’s 2007 review of ostracism offers theoretical context for why exclusion and being ignored may carry psychological significance.
Because this online self-report questionnaire is related to, not automatically identical with, published instruments, its results do not inherit their norms, validation statistics, or diagnostic status; memory, current context, self-awareness, and willingness to disclose may influence responses.
- Semenova, Galina V., Sevil A. Vekilova, and Olga V. Rudykhina. "Social Exclusion: Development and Testing of the Scale." Social Psychology and Society, vol. 13, no. 3, 2022, pp. 97-115. DOI 10.17759/sps.2022130307
- Suvorova, Irina Yu. "Development of a Trial Version of the Questionnaire to Determine the Experience of Exclusion from the Social System." Social Psychology and Society, vol. 7, no. 4, 2016, pp. 132-146. DOI 10.17759/sps.2016070409
- Williams, Kipling D. "Ostracism." Annual Review of Psychology, vol. 58, 2007, pp. 425-452. DOI 10.1146/annurev.psych.58.110405.085641
Updated: