
Proportions Quiz
How the Scales are Structured
Who Usually Takes This Test?
See How You Compare
Below is a preview of how scores are typically distributed across each scale.
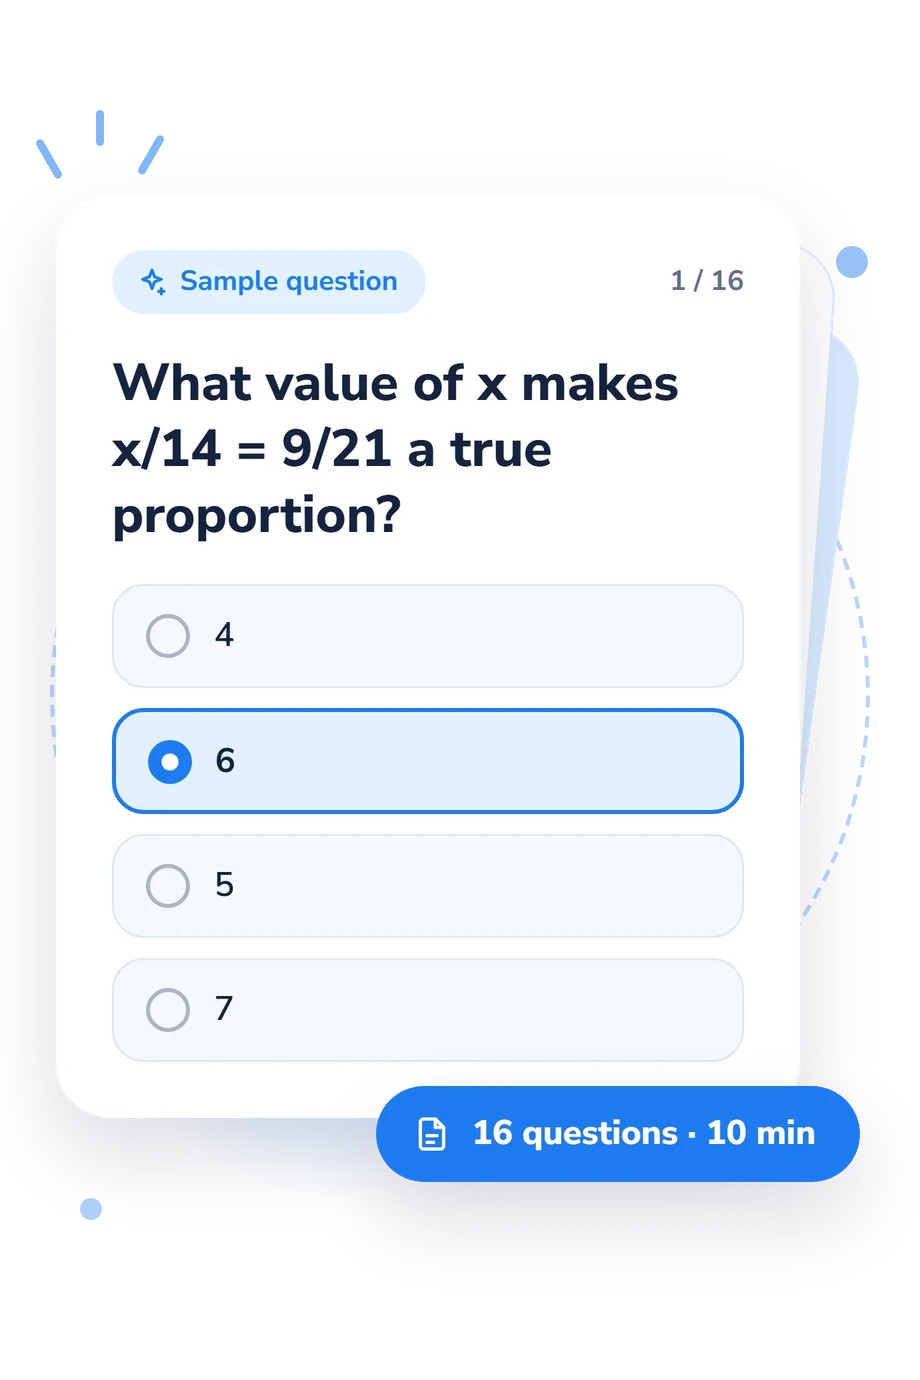
Example Questions From the Test
- 4
- 6
- 5
- 7
- 6 parts blue and 8 parts white
- 10 parts blue and 15 parts white
- 9 parts blue and 12 parts white
- 8 parts blue and 10 parts white
- 75%
- 72%
- 65%
- 80%
Proportions Quiz - Description and methodology of the test
Students, teachers, and independent learners can use this proportions quiz to examine how they reason through familiar mathematical situations. It can guide revision or classroom discussion without reducing proportional thinking to a single rule. For anyone checking a method, this quiz on solving proportions shows whether an approach handles equivalence, calculation, and context.
What This Assessment Explores
Questions move between equations and situations involving equivalent ratios, cross-products, percentages, unit rates, scale, constant speed, money, recipes, tables, and graphs. One item asks when direct proportion is inappropriate, so the assessment tests model selection as well as calculation.
As a proportion practice assessment, this questionnaire summarizes Proportions Knowledge (0-16) with three performance bands. The main skill areas represented by the questions are:
- Equivalent ratios show whether quantities can be scaled without changing a relationship.
- Cross-products show whether ratios are equal and help find an unknown.
- Rates and percentages show how quantities relate across units.
- Representations show whether tables, equations, graphs, and situations agree.
Foundations to Build (0-6) points to review; Developing Knowledge (7-12) reflects developing skill; Strong Knowledge (13-16) indicates consistent identification, solution, and application. These labels describe the level reflected by the total and suggest practice priorities.
Methodology and Scientific Basis
Each item presents a mathematical or applied problem with fixed multiple-choice answers. Contexts include symbolic proportions, mixtures, money, distance, shadows, recipes, tables, graphs, and equations. This structure samples transfer across representations rather than one memorized procedure.
Scoring summarizes the selected responses in the single displayed knowledge result; separate subscores for rates, ratios, or applications are not shown. The format is conceptually consistent with the Proportional Reasoning Test (Wafubwa et al., 2020), while Misailidou and Williams (2003) and Hilton et al. (2013) provide related diagnostic perspectives. It is not presented as an adaptation of those published instruments.
As a proportional reasoning assessment, it is best interpreted as a learning snapshot: it can suggest revisiting equivalence and cross-products or extending practice toward comparison, modeling, and application. Interpretation should follow the displayed descriptions, which connect the total with demonstrated ability to identify, solve, and apply proportional relationships across equations, tables, graphs, and everyday situations without extending beyond the skills sampled by these items.
Fixed choices make guessing and arithmetic slips relevant, while attention, current familiarity, and the learner’s approach to unfamiliar contexts can also affect performance. The result is one piece of evidence about present understanding, not a complete account of mathematical ability.
- Wafubwa, Ruth Nanjekho, Richmond Opoku-Sarkodie, and Csaba Csíkos. (2020). Construction and Validation of a Test for Measuring Students’ Proportional Reasoning on Rates, Ratios, & Proportions. International Journal of Pedagogy, Policy and ICT in Education, 8, 53-76.
- Misailidou, Christina, and Julian Williams. (2003). Diagnostic assessment of children’s proportional reasoning. The Journal of Mathematical Behavior, 22(3), 335-368. 10.1016/S0732-3123(03)00025-7
- Hilton, Annette, Geoff Hilton, Shelley Dole, and Merrilyn Goos. (2013). Development and application of a two-tier diagnostic instrument to assess middle-years students’ proportional reasoning. Mathematics Education Research Journal, 25(4), 523-545. 10.1007/s13394-013-0083-6
Updated: