
Most Likely Quiz
How the Scales are Structured
Who Usually Takes This Test?
See How You Compare
Below is a preview of how scores are typically distributed across each scale.
Example Questions From the Test
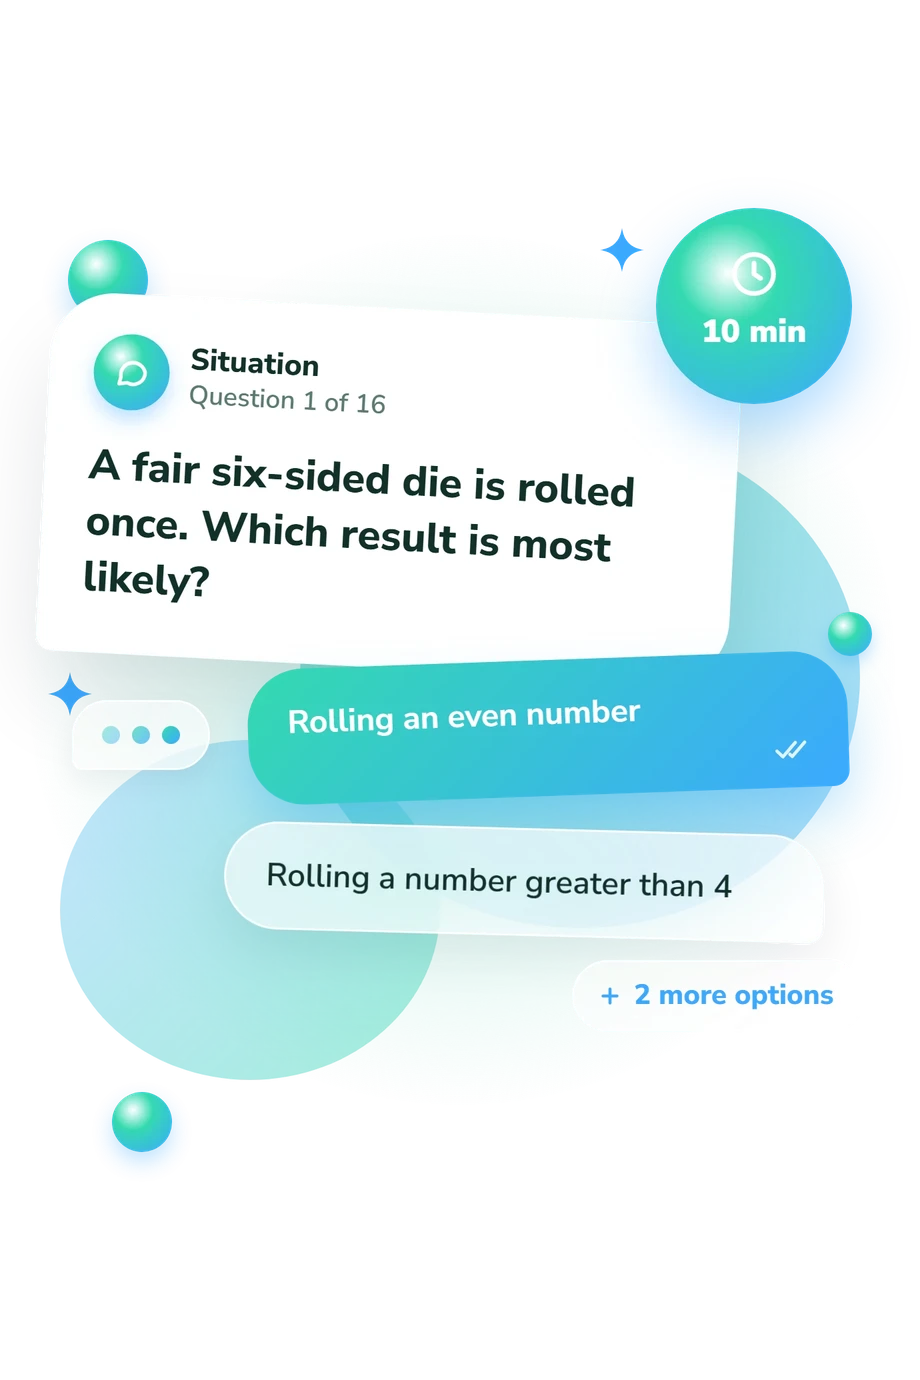
- Rolling an even number
- Rolling a number greater than 4
- Rolling a number less than 3
- Rolling exactly 6
- 4/52
- 4/51
- 3/52
- 3/51
- Less than 1/2 because tails is due
- More than 1/2 because heads is on a streak
- Exactly 1/2
- It cannot be estimated after a streak
Most Likely Quiz - Description and methodology of the test
People who want a clearer grasp of everyday chance can use this assessment to check how they compare probabilities, read percentages, and reason from short numerical scenarios. The Most Likely Quiz is suited to learners and anyone who wants a focused probability check rather than a broad mathematics exam. The result from this probability quiz places performance in a broad probability-knowledge band and can guide general practice.
What This Assessment Measures
At its core, this questionnaire measures whether a person can interpret and compare probabilities in familiar situations. It covers direct likelihoods, representative sampling, independence, complements, proportions, expected outcomes, and joint events. The emphasis is practical judgment with basic probability ideas rather than algebra.
The main reasoning groups are:
- Likelihood and sampling show whether the result compares chances and recognizes representative selection.
- Independence, complements, and proportions show whether the respondent handles unaffected events, “not” probabilities, and rates.
- Expected and combined outcomes show how long-run frequency and sequential chances are understood.
The result uses Probability Knowledge: 0-16. Foundations to build (0-6) signals a need to review core ideas; Developing judgment (7-12) reflects capable everyday reasoning with some gaps; Strong knowledge (13-16) indicates consistent accuracy across the tested concepts. This probability knowledge test can point to topics for practice.
Methodology and Evidence Base
Each item presents a brief scenario and four answer choices. Selecting the best option tests recognition and application of probability principles rather than extended calculation. The result summarizes performance across the answers; the displayed bands provide the score interpretations for these questions.
In this chance reasoning quiz, items sample direct comparison, sampling quality, independent trials, complements, proportions, expected frequency, and linked events. The score summarizes performance but cannot identify the misconception behind an error or predict reasoning in an unfamiliar setting.
The methodology is conceptually consistent with the Probabilistic Reasoning Scale (Primi et al., 2017), whose construction used item response theory to model probabilistic skills, and with the Berlin Numeracy Test (Cokely et al., 2012), which uses short probability and numeracy problems to examine quantitative understanding relevant to risk. This questionnaire is not presented as an adaptation or standardized administration of either instrument.
Interpret the result as a snapshot of performance on these questions. Familiarity with percentages, attention, arithmetic fluency, guessing, and current context can affect it, so the score is best used to guide practice rather than represent mathematical ability.
- Primi, Caterina, Kinga Morsanyi, Maria Anna Donati, Silvia Galli, and Francesca Chiesi. (2017). Measuring Probabilistic Reasoning: The Construction of a New Scale Applying Item Response Theory. Journal of Behavioral Decision Making, 30(4), 933-950. 10.1002/bdm.2011
- Cokely, Edward T., Mirta Galesic, Eric Schulz, Saima Ghazal, and Rocio Garcia-Retamero. (2012). Measuring Risk Literacy: The Berlin Numeracy Test. Judgment and Decision Making, 7(1), 25-47. 10.1017/S1930297500001819
Updated: