
Freudly+971 508685814hello@freudly.ai
Freudly
creativity

Williams Rating Scale Test
Take the online Williams Rating Scale Test - AI psychologist FreudlyYou can take Williams Rating Scale Testhere. Online version of a simple and accurate psychological test with interpretation.en
Understand a child or teen’s creative thinking and traits in about 9 minutes. Combines drawing tasks, self-report, and adult ratings to reveal strengths and guide support.
Start Online Test
Questions: 489 minutes
08:30
October 2, 2025
October 2, 2025
Material has been updated
October 2, 2025
Material has been published
17,836 views
1,352 completions
1,088 likes
Verified by Daniel Hall
Psychologist with 25 years of experience
Share
Scale Explorer

How the Scales are Structured

example score
5/12
Imagination (I)
Measures the child’s capacity to form mental images and envision novel or nonexistent objects and situations.
Lower
Moderate
High
04: Lower | 58: Moderate | 912: High
A score of 5 falls in the Moderate range, suggesting an average ability to generate and elaborate mental images with some room for further development.
example score
8/12
Curiosity (C)
Curiosity measures a child's tendency to seek new information and actively explore their environment.
Low
Moderate
High
04: Low | 58: Moderate | 912: High
A score of 8 falls in the Moderate range, suggesting a consistent interest in learning and exploring new things.
example score
10/12
Risk-Taking Tendency (RTT)
Measures willingness to try unconventional approaches and accept possible failure in pursuit of creative ideas.
Cautious
Balanced
Bold
04: Cautious | 58: Balanced | 912: Bold
A score of 10 falls in the Bold range, suggesting a strong tendency to take creative risks and experiment with new approaches.
example score
10/12
Complexity (C)
Difficulty reflects the tendency to develop creative ideas into complex, detailed, and well-structured solutions.
Lower complexity
Moderate complexity
Higher complexity
04: Lower complexity | 58: Moderate complexity | 912: Higher complexity
A score of 10 falls in the Higher complexity range, suggesting a strong preference for tackling and elaborating multifaceted creative tasks with thorough development.
example score
5/12
Elaboration (E)
Developedness reflects how well a child elaborates and expands ideas to make them complete and detailed.
Low elaboration
Moderate elaboration
High elaboration
04: Low elaboration | 58: Moderate elaboration | 912: High elaboration
A score of 5 indicates a moderate tendency to add detail and refinement to ideas, with room to develop fuller elaboration.
example score
5/12
Originality (O)
Originality measures how often a child generates unusual, unconventional ideas that differ from typical or expected responses.
Lower originality
Moderate originality
Higher originality
04: Lower originality | 58: Moderate originality | 912: Higher originality
A score of 5 falls in the Moderate originality range, suggesting the child sometimes offers unconventional ideas but may do so inconsistently across situations.
example score
4/12
Flexibility (F)
Flexibility measures how readily a child shifts between different categories of ideas and approaches when solving tasks.
Low
Moderate
High
04: Low | 58: Moderate | 912: High
A score of 4 falls in the Low range, suggesting the child tends to use a narrower set of idea categories and may shift perspectives less often during creative problem-solving.
example score
4/12
Fluency (F)
Fluency measures how quickly a child can produce many different ideas or solutions within a limited time.
Low
Moderate
High
04: Low | 58: Moderate | 912: High
A score of 4 falls in the Low range, suggesting the child generated fewer ideas quickly than typically expected on this scale.
example score
55/96
Williams Scale (WS)
Assesses overall creative potential and creative thinking based on traits such as fluency, flexibility, and originality.
Low
Average
High
038: Low | 3971: Average | 7296: High
A score of 55 falls in the Average range, suggesting a typical level of creative abilities relative to the scale’s norms.
Start Online Test
just completed the test
DATA-BASED USER COHORTS

Who Usually Takes This Test?

Parents of curious kids
41%OF USERS
Parents use it to understand a child’s creative strengths and where to support them at home or in extracurricular activities.
Teachers and school counselors
34%OF USERS
Educators complete the rating scale to spot creative potential in students and plan classroom strategies or enrichment.
Child psychologists and assessors
25%OF USERS
Clinicians use the combined tasks and questionnaires to build a fuller profile of creativity for evaluation and guidance.
BASED ON AGGREGATED, ANONYMIZED DATA FROM TENS OF THOUSANDS OF FREUDLY USERS.
Benchmarking

See How You Compare

Once you complete the test, your results are compared with real-world data from people in your country.
Below is a preview of how scores are typically distributed across each scale.
Imagination (I)
Imagination (I)
Average
3.9
Normal range
2.35.4
min.
0
max.
12
This curve shows how scores are typically distributed.
Once you complete the test, your result will appear on the scale so you can see how you compare.
Curiosity (C)
Curiosity (C)
Average
7.5
Normal range
5.49.7
min.
0
max.
12
This curve shows how scores are typically distributed.
Once you complete the test, your result will appear on the scale so you can see how you compare.
Risk Tolerance (RT)
Risk Tolerance (RT)
Average
4.2
Normal range
2.26.2
min.
0
max.
12
This curve shows how scores are typically distributed.
Once you complete the test, your result will appear on the scale so you can see how you compare.
Difficulty (D)
Difficulty (D)
Average
6.1
Normal range
4.77.6
min.
0
max.
12
This curve shows how scores are typically distributed.
Once you complete the test, your result will appear on the scale so you can see how you compare.
Developedness (D)
Developedness (D)
Average
3.9
Normal range
1.85.9
min.
0
max.
12
This curve shows how scores are typically distributed.
Once you complete the test, your result will appear on the scale so you can see how you compare.
Originality (O)
Originality (O)
Average
6.8
Normal range
4.88.9
min.
0
max.
12
This curve shows how scores are typically distributed.
Once you complete the test, your result will appear on the scale so you can see how you compare.
Flexibility (F)
Flexibility (F)
Average
8.6
Normal range
7.110.1
min.
0
max.
12
This curve shows how scores are typically distributed.
Once you complete the test, your result will appear on the scale so you can see how you compare.
Fluency (F)
Fluency (F)
Average
8.5
Normal range
6.610.4
min.
0
max.
12
This curve shows how scores are typically distributed.
Once you complete the test, your result will appear on the scale so you can see how you compare.
Williams Scale (WS)
Williams Scale (WS)
Average
40.2
Normal range
23.856.7
min.
0
max.
96
This curve shows how scores are typically distributed.
Once you complete the test, your result will appear on the scale so you can see how you compare.
Featured On
SAMPLE QUESTIONS

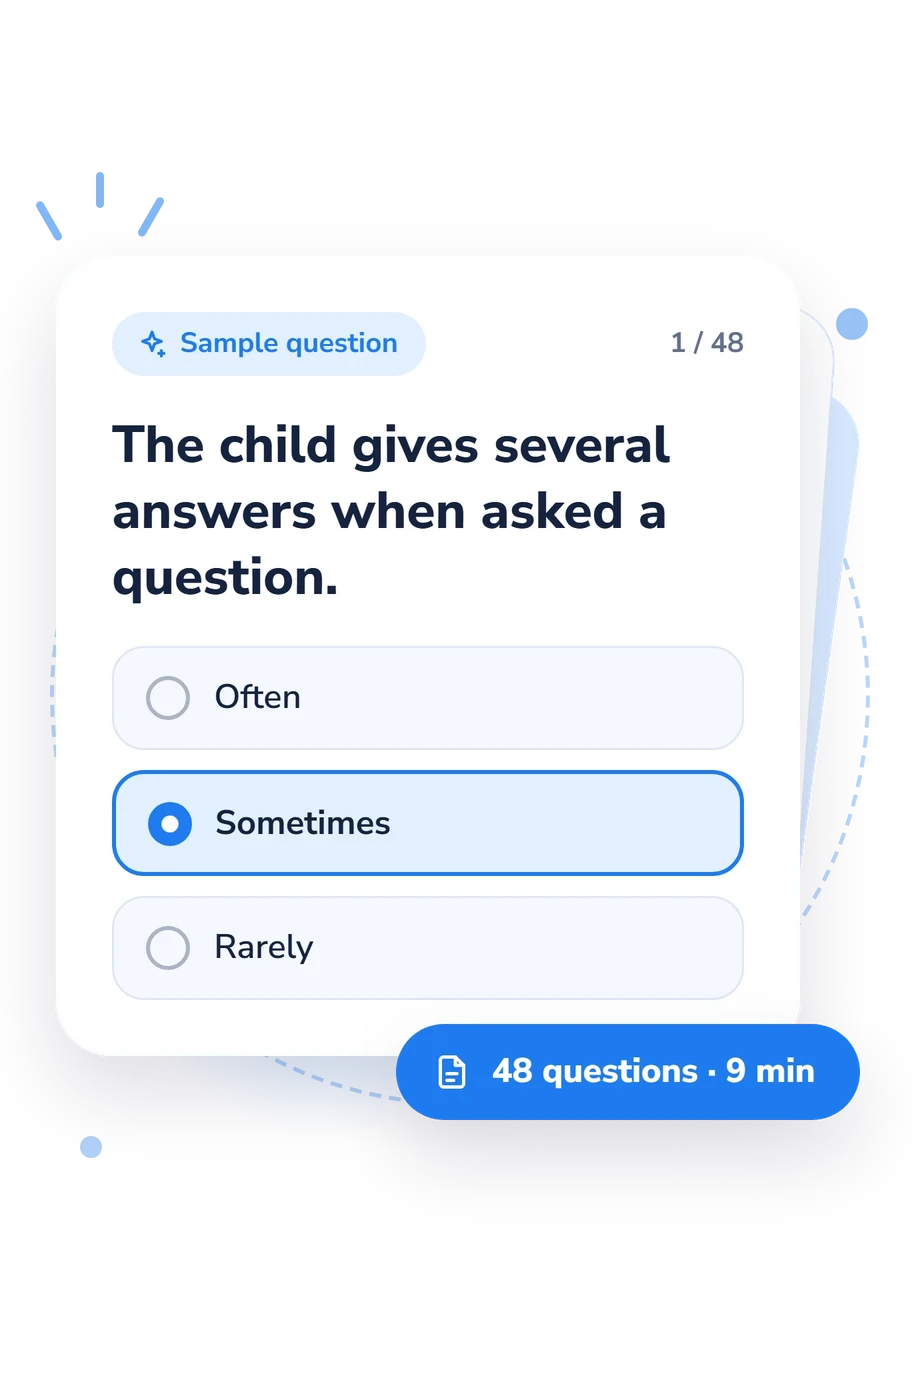
Example Questions From the Test

    • Often
    • Sometimes
    • Rarely
    • Often
    • Sometimes
    • Rarely
    • Often
    • Sometimes
    • Rarely
WHAT THE TEST MEASURES
About This Assessment
Williams Rating Scale Test

Williams Rating Scale Test - Symptoms and Signs

creativity

This measure is designed to support the assessment of creativity-related characteristics in children and adolescents. The Williams Rating Scale is used to gather information about cognitive and behavioral indicators that may be associated with creative potential across everyday settings.

The instrument includes 48 items and typically takes about 9 minutes to complete. Content is intended to capture multiple facets of creativity, including aspects of divergent thinking and personal characteristics, and may incorporate both self-report (for older youth) and adult informant ratings (e.g., parent or teacher). As described by J. C. Williams, results from the Williams Rating Scale are generally interpreted as part of a broader evaluation and should be considered alongside developmental history, context, and other assessment data.

Author: J. C. Williams
Literature: Runco, M. A., & Acar, S. Divergent thinking as an indicator of creative potential. Creativity Research Journal. 2012.; Kaufman, J. C., Plucker, J. A., & Baer, J. Essentials of creativity assessment. John Wiley & Sons. 2008.
Popular tests
Comments
Leave a Comment