
Sensory Preferences Questionnaire Test
How the Scales are Structured
Who Usually Takes This Test?
See How You Compare
Below is a preview of how scores are typically distributed across each scale.
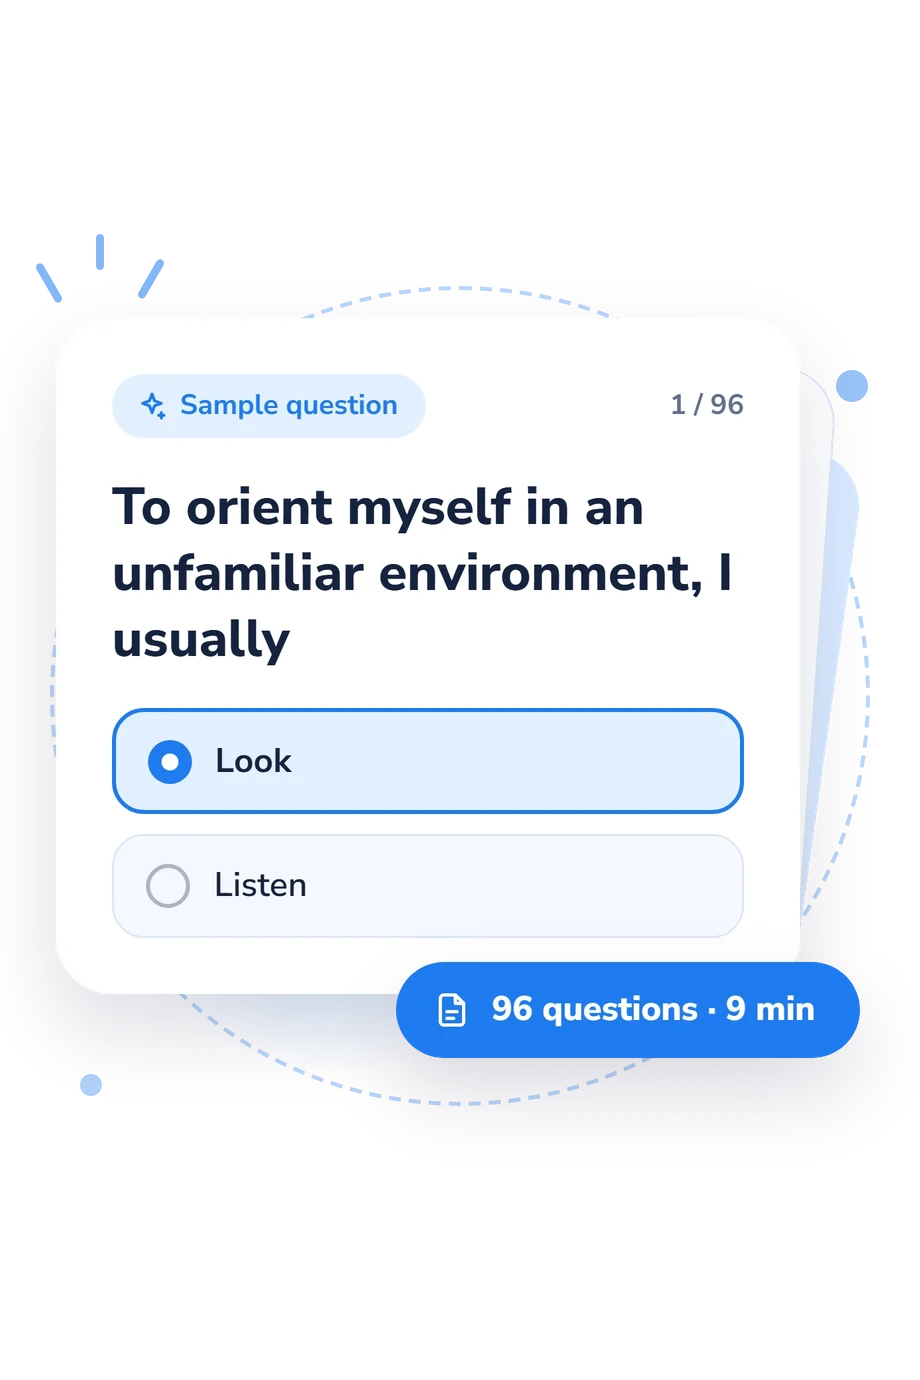
Example Questions From the Test
- Look
- Listen
- listen
- rely on my intuition
- Rely on an inner feeling
- Construct a model of the situation
Sensory Preferences Questionnaire Test - Description and methodology of the test
People who want to understand how they take in information can use the Sensory Preferences Questionnaire Test as a structured self-reflection exercise. It is suitable for anyone curious about whether meaning, bodily sensation, visual observation, or sound tends to guide attention and understanding. The result offers a sensory preference profile, showing your level on each of four preference dimensions.
What This Assessment Explores
The questionnaire examines sensory processing preferences in attention, comprehension, music, relaxation, and social exchange. Its paired situations invite the respondent to notice which cues feel most informative or natural. Each score describes one channel separately across these situations; the four levels are not a ranking.
The four result dimensions are:
- Digital (0-100) reflects attention to semantic and logical meaning; bands are Low digital focus (0-33), Moderate digital focus (34-66), and High digital focus (67-100).
- Kinesthetic (0-100) reflects bodily sensation, touch, and internal physical feeling; bands are Low (0-33), Moderate (34-66), and High (67-100).
- Visual (0-100) reflects facial, gestural, postural, and appearance-based cues; bands are Low visual preference (0-33), Moderate visual preference (34-66), and High visual preference (67-100).
- Auditory (0-100) reflects speech, intonation, voice timbre, and environmental sound; bands are Low (0-33), Moderate (34-66), and High (67-100).
Methodology and Scientific Basis
Paired alternatives shape the response format. Items contrast choices such as looking or listening, inner feeling or constructing a model, and vocal tone or explicit verbal feedback. Selecting the option that fits best creates a pattern of preferences rather than a single yes-or-no judgment.
The displayed scoring presents four scores from 0-100. The questionnaire does not state a per-answer weighting formula, so the result cannot be manually reconstructed from the ranges alone.
The conceptual reference is Vasilyeva’s 1997 work on Representational Systems, which describes distinct modes of organizing experience. The questionnaire is a sensory preferences assessment that uses this vocabulary, while the 2008 work by Eidemiller and Yustitskis provides related family-psychology context. A 2021 study by Júnior and colleagues examines automatic detection of preferred representational systems in another setting. These works support the framework's vocabulary, not a claim that this online version is a validated adaptation of any one source instrument.
Read the result as a context-sensitive self-report profile. Current mood, self-awareness, and response style may affect choices; the displayed bands are descriptive rather than standardized diagnostic thresholds.
- Vasilyeva, N. L. (1997). Representational Systems and Their Role in the Formation of Relationships in Families of Children and Adolescents with Borderline Neuropsychic Disorders: Dissertation. V. M. Bekhterev Psychoneurological Research Institute, Saint Petersburg.
- Eidemiller, E. G., & Yustitskis, V. V. (2008). Psychology and Psychotherapy of the Family (4th revised and expanded ed.). Saint Petersburg: Piter. ISBN 978-5-91180-838-9.
- Júnior, M. C., Santos, B. S., Mendonça, M., Corumba, D., & Farias, M. A. de F. (2021). Industrial and OSS developers’ profiles: a family of experiments to evaluate a pioneering neuro-linguistic method for preferred representational systems automatic detection. Journal of the Brazilian Computer Society, 27, Article 4. 10.1186/s13173-021-00107-9
Updated: