
Freudly+971 508685814hello@freudly.ai
Freudly
team climate

Team Effectiveness Assessment Test
Take the online Team Effectiveness Assessment Test - AI psychologist FreudlyYou can take Team Effectiveness Assessment Testhere. Online version of a simple and accurate psychological test with interpretation.en
Understand how well your team connects, stays engaged, and drives results in about 16 minutes. Get clear, actionable insights to improve communication, motivation, and performance fast.
Start Online Test
Questions: 8416 minutes
08:30
October 2, 2025
October 2, 2025
Material has been updated
October 2, 2025
Material has been published
16,023 views
1,200 completions
1,057 likes
Verified by Daniel Hall
Psychologist with 25 years of experience
Share
Scale Explorer

How the Scales are Structured

example score
6/7
Organizational Support (OS)
Measures how strongly the organization provides the team with resources, conditions, and backing needed for effective work.
Limited support
Adequate support
Strong support
02: Limited support | 35: Adequate support | 67: Strong support
A score of 6 indicates strong organizational support, suggesting the team generally has the resources and conditions needed to perform effectively.
example score
3/7
Regular Review (RR)
Measures how regularly the team reviews and evaluates its performance to identify improvements.
Infrequent review
Occasional review
Systematic review
02: Infrequent review | 35: Occasional review | 67: Systematic review
A score of 3 suggests the team reviews performance occasionally, with some monitoring in place but not yet consistently structured.
example score
5/7
Appropriate Leadership (AL)
Assesses how effectively team leadership provides direction, support, and coordination for members.
Limited guidance
Adequate guidance
Strong guidance
02: Limited guidance | 35: Adequate guidance | 67: Strong guidance
A score of 5 indicates adequate guidance, suggesting leadership generally provides clear direction and support with some room to strengthen consistency and influence.
example score
3/7
Sound Procedures (SP)
Measures how consistently the team uses clear, effective, and rational procedures to organize work.
Ad hoc
Developing
Well-structured
02: Ad hoc | 35: Developing | 67: Well-structured
A score of 3 indicates procedures are emerging but may be inconsistently applied, leaving room to clarify rules and standardize workflows.
example score
4/7
Collaboration and Conflict (CaC)
Measures how well the team balances collaboration with constructive conflict resolution in day-to-day work.
Conflict-prone
Mixed dynamics
Cooperative
02: Conflict-prone | 35: Mixed dynamics | 67: Cooperative
A score of 4 suggests generally workable cooperation with occasional friction, indicating benefit from clearer norms for discussing and resolving disagreements.
example score
3/7
Support and Trust (SaT)
Measures how much team members rely on and support each other in day-to-day collaboration.
Low
Moderate
High
02: Low | 35: Moderate | 67: High
A score of 3 indicates moderate support and trust, suggesting some reliable collaboration but also room to strengthen openness and mutual help.
example score
2/7
Openness and Constructive Confrontation (OaCC)
Measures how openly the team discusses problems and how willing it is to engage in constructive confrontation to resolve disagreements.
Low openness
Developing openness
High openness
02: Low openness | 35: Developing openness | 67: High openness
A score of 2 suggests the team is currently less likely to surface issues directly, so disagreements may remain unaddressed or be handled indirectly.
example score
5/7
Clear Aspirations and Shared Goals (CAaSG)
Measures how clearly the team’s aspirations are defined and how well members align on shared goals and objectives.
Unclear goals
Partially aligned
Well aligned
02: Unclear goals | 35: Partially aligned | 67: Well aligned
A score of 5 suggests the team generally understands the objectives, though some goals or priorities may still need clarification to achieve full alignment.
example score
3/7
Balanced Roles (BR)
Measures how evenly and effectively team roles and functions are distributed across members to support coordinated work toward shared goals.
Imbalanced roles
Partially balanced
Well balanced
02: Imbalanced roles | 35: Partially balanced | 67: Well balanced
A score of 3 indicates partially balanced roles, suggesting some key functions are covered but role distribution may still limit smooth coordination and shared accountability.
example score
4/7
Constructive Intragroup Relationships (CIR)
Measures how constructive and respectful the relationships and interactions are within the team.
Strained
Mixed
Constructive
02: Strained | 35: Mixed | 67: Constructive
A score of 4 falls in the Mixed range, suggesting generally workable relationships with some recurring friction or inconsistency in mutual support.
example score
2/7
Effective Communication (EC)
Measures how freely and effectively team members exchange information and coordinate with one another.
Limited communication
Adequate communication
Strong communication
02: Limited communication | 35: Adequate communication | 67: Strong communication
A score of 2 suggests communication is limited, with information exchange likely inconsistent or constrained across the team.
example score
2/7
Individual Development (ID)
Assesses how much the team environment supports individual personal and professional development opportunities.
Limited support
Developing support
Strong support
02: Limited support | 35: Developing support | 67: Strong support
A score of 2 indicates limited support for personal development, suggesting development opportunities are not yet consistently encouraged or enabled within the team.
Start Online Test
just completed the test
DATA-BASED USER COHORTS

Who Usually Takes This Test?

Team leads and managers
41%OF USERS
They use it to spot teamwork bottlenecks, improve communication, and align the group around shared goals and results.
HR and people partners
34%OF USERS
They run it to diagnose engagement and relationship issues across teams and plan targeted development actions.
Project and delivery teams
25%OF USERS
They take it to check how well they collaborate under deadlines and identify concrete ways to work smoother together.
BASED ON AGGREGATED, ANONYMIZED DATA FROM TENS OF THOUSANDS OF FREUDLY USERS.
Benchmarking

See How You Compare

Once you complete the test, your results are compared with real-world data from people in your country.
Below is a preview of how scores are typically distributed across each scale.
Organizational Support (OS)
Average
2.2
Normal range
1.23.2
min.
0
max.
7
This curve shows how scores are typically distributed.
Once you complete the test, your result will appear on the scale so you can see how you compare.
Regular Review (RR)
Regular Review (RR)
Average
3.2
Normal range
24.4
min.
0
max.
7
This curve shows how scores are typically distributed.
Once you complete the test, your result will appear on the scale so you can see how you compare.
Suitable guidance (Sg)
Average
3
Normal range
24
min.
0
max.
7
This curve shows how scores are typically distributed.
Once you complete the test, your result will appear on the scale so you can see how you compare.
Rational Procedures (RP)
Average
2.3
Normal range
1.43.3
min.
0
max.
7
This curve shows how scores are typically distributed.
Once you complete the test, your result will appear on the scale so you can see how you compare.
Cooperation and Conflict (CaC)
Average
1.9
Normal range
12.7
min.
0
max.
7
This curve shows how scores are typically distributed.
Once you complete the test, your result will appear on the scale so you can see how you compare.
Support and Trust (SaT)
Average
4
Normal range
2.85.2
min.
0
max.
7
This curve shows how scores are typically distributed.
Once you complete the test, your result will appear on the scale so you can see how you compare.
Openness and Confrontation (OaC)
Average
5.1
Normal range
4.16.1
min.
0
max.
7
This curve shows how scores are typically distributed.
Once you complete the test, your result will appear on the scale so you can see how you compare.
Clear aspirations and aligned goals (Caaag)
Average
3.2
Normal range
24.4
min.
0
max.
7
This curve shows how scores are typically distributed.
Once you complete the test, your result will appear on the scale so you can see how you compare.
Balanced Roles (BR)
Balanced Roles (BR)
Average
3.4
Normal range
2.24.5
min.
0
max.
7
This curve shows how scores are typically distributed.
Once you complete the test, your result will appear on the scale so you can see how you compare.
Rational Intragroup Relations (RIR)
Average
2.3
Normal range
1.13.6
min.
0
max.
7
This curve shows how scores are typically distributed.
Once you complete the test, your result will appear on the scale so you can see how you compare.
Good communication (Gc)
Average
5.1
Normal range
4.26
min.
0
max.
7
This curve shows how scores are typically distributed.
Once you complete the test, your result will appear on the scale so you can see how you compare.
Personal Development (PD)
Average
2.5
Normal range
1.43.6
min.
0
max.
7
This curve shows how scores are typically distributed.
Once you complete the test, your result will appear on the scale so you can see how you compare.
Featured On
SAMPLE QUESTIONS

Example Questions From the Test

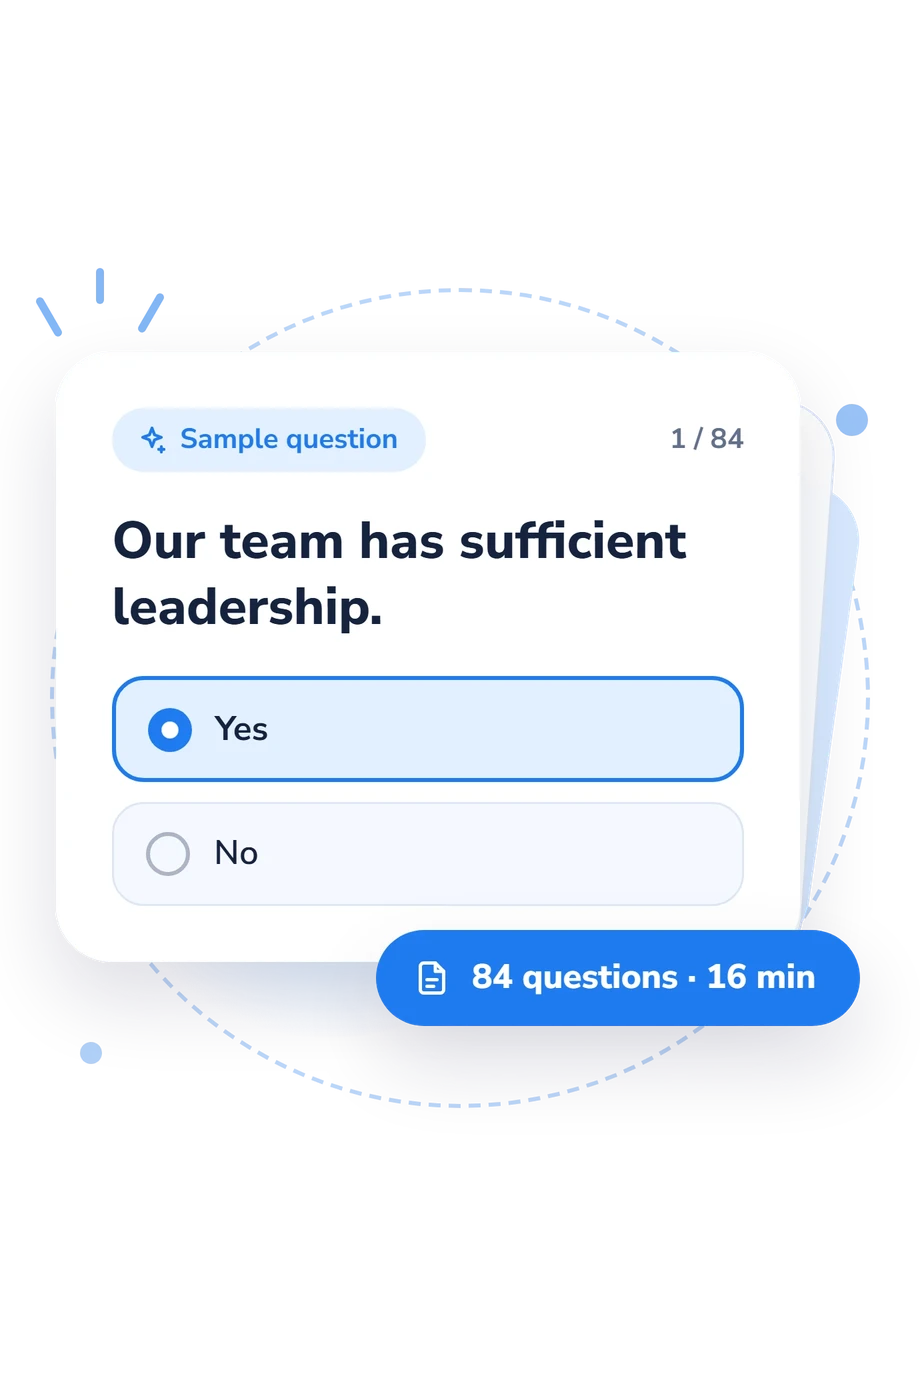
Read the statements that describe your team and answer “Yes” to those you agree with. If you believe a statement is not entirely true, select “No.” Do not spend much time considering each statement; a few seconds is sufficient. Keep in mind that the results will be meaningful only if you respond honestly.
    • Yes
    • No
    • Yes
    • No
    • Yes
    • No
WHAT THE TEST MEASURES
About This Assessment
Team Performance Evaluation Test

Team Effectiveness Assessment Test - Symptoms and Signs

team climate
arrange

This measure is designed to provide a structured snapshot of perceived functioning within a work group. The Team Effectiveness Assessment is typically used to support discussion of team processes, including collaboration and shared goal focus.

It consists of 84 items and takes about 16 minutes to complete. Items sample perceptions of interpersonal dynamics, engagement in collective work, and motivation toward results, yielding a profile that can help identify relative strengths and areas for improvement.

The Team Effectiveness Assessment is often attributed to M. Woodcock, although documentation of original authorship may be limited. Results are commonly used as an adjunct to consultation, coaching, or team development planning, and should be interpreted in context alongside other sources of information (e.g., observation, performance indicators, and organizational constraints).

Author: M. Woodcock
Popular tests
Comments
Leave a Comment