
Pro-Environmental Behavior Scale Test
How the Scales are Structured
Who Usually Takes This Test?
See How You Compare
Below is a preview of how scores are typically distributed across each scale.
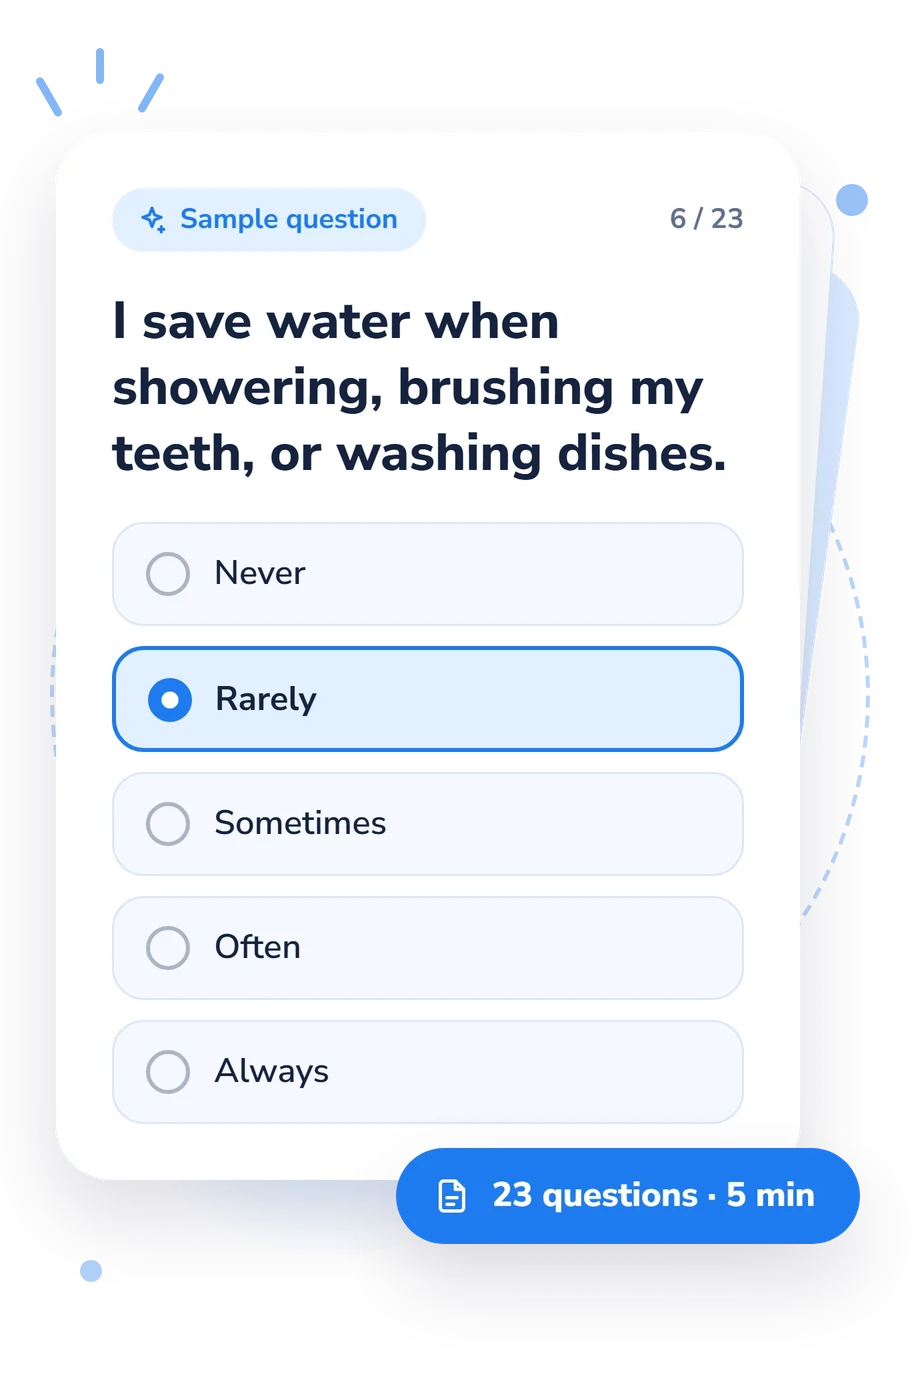
Example Questions From the Test
- Never
- Rarely
- Sometimes
- Often
- Always
- Never
- Rarely
- Sometimes
- Often
- Always
- Never
- Rarely
- Sometimes
- Often
- Always
Pro-Environmental Behavior Scale Test - Description and methodology of the test
People who want to understand how their routine choices affect the environment can use the Pro-Environmental Behavior Scale Test to examine patterns across private habits and public participation. As an environmental behavior questionnaire, it helps readers compare everyday actions, notice uneven areas in their profile, and choose practical behaviors to reflect on or change.
What This Assessment Explores
Behavior, not knowledge or concern, is the focus. Anyone can reflect on sustainable lifestyle habits across transport, consumption, conservation, waste, and civic action.
These are the result dimensions:
- Climate-Friendly (Transportation) Actions (1-5) measures climate-friendly travel: Low engagement 1-2.4; Moderate engagement 2.5-3.7; High engagement 3.8-5.
- Sustainable Consumption (1-5) measures purchasing choices: Low 1-2.4; Moderate 2.5-3.4; High 3.5-5.
- Resource Conservation (1-5) measures saving resources: Low conservation 1-2.3; Moderate conservation 2.4-3.6; High conservation 3.7-5.
- Social Action (1-5) measures collective participation: Low engagement 1-2.3; Moderate engagement 2.4-3.6; High engagement 3.7-5.
- Waste Management (1-5) measures waste handling: Low engagement 1-2.3; Moderate engagement 2.4-3.6; High engagement 3.7-5.
Methodology and Evidence Base
Each statement uses five-point responses from Never to Always. Results are presented as a profile across the dimensions listed above. Because some items describe lower-impact choices while others ask about behaviors associated with greater environmental impact, a high response does not carry identical meaning in every item. The point-allocation rule is unspecified, so no extra scoring formula should be inferred.
The questionnaire is conceptually consistent with the Russian Scale of Pro-Environmental Behavior (Ivanova et al., 2023), but it is not presented as an adaptation of that published instrument, and its online scores have no stated independent norms. Sautkina and colleagues’ 2022 systematic review places these behavioral domains within broader research on pro-environmental behavior. Kormos and Gifford’s 2014 meta-analysis identifies self-report limits including recall error, social desirability, and differences between reported and observed conduct.
Consequently, this pro-environmental behavior assessment is best read as a structured snapshot of current routines. Answers may be influenced by recent circumstances, self-awareness, recall error, social desirability, and differences between reported and observed conduct, so the profile is most useful for identifying which routines vary across travel, consumption, conservation, waste management, and collective participation.
- Alexandra A. Ivanova, Fatikha Agissova, Elena V. Sautkina, Veronika S. Kabanova, Nataliya A. Patrakova, and Kingsley Ivande (2023). Russian Scale of Pro-Environmental Behavior: Development and Psychometric Assessment. Experimental Psychology (Russia), 16(2), 218-234. 10.17759/exppsy.2023160213
- Elena V. Sautkina, Fatikha B. Agissova, Alexandra A. Ivanova, Kingsley S. Ivande, and Veronika S. Kabanova (2022). Pro-Environmental Behaviour in Russia. A Systematic Review. Experimental Psychology (Russia), 15(2), 172-193. 10.17759/exppsy.2022150213
- Christine Kormos and Robert Gifford (2014). The validity of self-report measures of proenvironmental behavior: A meta-analytic review. Journal of Environmental Psychology, 40, 359-371. 10.1016/j.jenvp.2014.09.003
Updated: