
Data Analysis Quiz
How the Scales are Structured
Who Usually Takes This Test?
See How You Compare
Below is a preview of how scores are typically distributed across each scale.
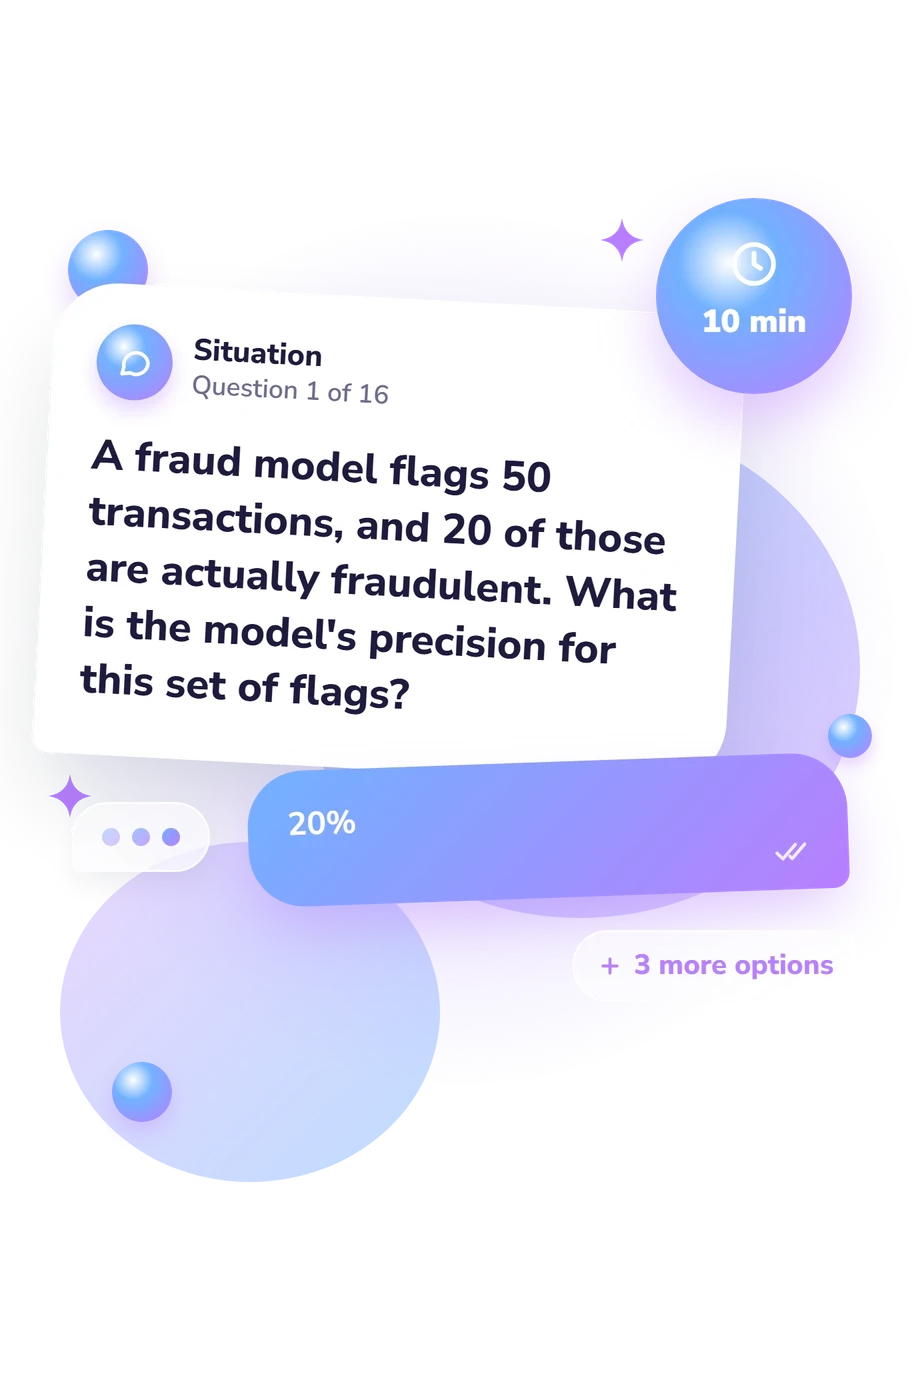
Example Questions From the Test
- 20%
- 30%
- 40%
- 60%
- The association proves that the data were collected incorrectly
- Ice cream sales must directly cause sunburn
- Sunburn must directly increase ice cream demand
- A third factor, such as hot sunny weather, may influence both
- A single variable
- A summary statistic
- A category label
- A single observation
Data Analysis Quiz - Description and methodology of the test
People who want to assess their knowledge and practical reasoning with everyday data can use this data analysis quiz as a focused skills check. It suits learners, working analysts, and anyone building a foundation in evidence-based decisions, while this data analyst quiz identifies topics worth revisiting for data-focused work. The result gives one overall indication of knowledge across the covered concepts, while reviewing individual questions can help someone preparing for data analyst work identify topics worth revisiting.
What This Assessment Explores
It examines practical reasoning across statistics, data preparation, databases, predictive modeling, and interpretation. Questions ask you to recognize sound choices: reading precision and confidence intervals, spotting sampling bias and leakage, selecting joins and grouping logic, and separating association from causation.
Learners can use this data analytics quiz to see which ideas are secure and which deserve review.
The main thematic areas are:
- Statistical reasoning and interpretation show how well you read uncertainty, standardized values, typical values, and model error.
- Data quality and study design reveal whether you notice missingness, unrepresentative samples, leakage, and duplicated records.
- SQL, modeling, and communication test whether you choose suitable joins, grouping logic, charts, experiments, and interpretations of predictions.
Its single displayed scale is Data Analysis Knowledge (0-16), with Foundations to build (0-6), Developing knowledge (7-12), and Strong working knowledge (13-16).
Methodology and Evidence Base
Each item presents a short analytical scenario with four answer choices, such as a join, transformation, estimate, chart, or statistical interpretation. Responses produce one of the displayed result bands; the questionnaire's point-calculation method is not stated.
The content is conceptually consistent with the 2013 work by Foster Provost and Tom Fawcett, especially its emphasis on framing data problems and evaluating evidence. Statistical reasoning corresponds with principles presented by David Diez, Christopher Barr, and Mine Çetinkaya-Rundel in their 2019 text, while the 2021 predictive-modeling work by Gareth James and colleagues supports predictive modeling and model evaluation. SQL questions reflect relational ideas associated with Edgar F. Codd's 1970 paper. The questionnaire is therefore a focused data analysis test, and these works support concepts relevant to its questions without establishing its provenance.
The three bands are catalogue-defined result categories. Interpretation is limited to the concepts covered: performance can vary with prior terminology exposure, careful reading, guessing, and testing context, so the result is most useful alongside practice rather than as a complete measure of analytical ability.
- Provost, Foster, and Tom Fawcett. Data Science for Business: What You Need to Know about Data Mining and Data-Analytic Thinking. O'Reilly Media, 2013.
- Diez, David M., Christopher D. Barr, and Mine Çetinkaya-Rundel. OpenIntro Statistics. 4th ed. OpenIntro, 2019.
- James, Gareth, Daniela Witten, Trevor Hastie, and Robert Tibshirani. An Introduction to Statistical Learning with Applications in R. 2nd ed. Springer, 2021. 10.1007/978-1-0716-1418-1.
- Codd, E. F. A Relational Model of Data for Large Shared Data Banks. Communications of the ACM, 13(6), 377-387, 1970. 10.1145/362384.362685.
Updated: