
Freudly+971 508685814hello@freudly.ai
Freudly
pedagogy

University Digital Educational Environment Assessment Scale (AUDEE-Tch) Test
Take the online University Digital Educational Environment Assessment Scale (AUDEE-Tch) Test - AI psychologist FreudlyYou can take University Digital Educational Environment Assessment Scale (AUDEE-Tch) Testhere. Online version of a simple and accurate psychological test with interpretation.en
Understand how instructors experience the university’s digital learning environment in about 7 minutes. Get a clear snapshot from 38 questions to pinpoint strengths, pain points, and support needs.
Start Online Test
Questions: 387 minutes
08:30
October 2, 2025
October 2, 2025
Material has been updated
October 2, 2025
Material has been published
13,410 views
1,602 completions
1,382 likes
Verified by Daniel Hall
Psychologist with 25 years of experience
Share
Scale Explorer

How the Scales are Structured

example score
6/9
Accessibility (A)
Measures how accessible and easy to use the university’s digital learning environment feels for an instructor.
Low accessibility
Moderate accessibility
High accessibility
03: Low accessibility | 46: Moderate accessibility | 79: High accessibility
A score of 6 indicates moderate perceived accessibility, suggesting the environment is generally usable but may still present some friction or barriers in everyday teaching tasks.
example score
5/9
Dishonest Strategies (DS)
Assesses the tendency to use dishonest strategies when working in the university’s digital educational environment.
Low tendency
Moderate tendency
High tendency
03: Low tendency | 46: Moderate tendency | 79: High tendency
A score of 5 falls in the Moderate tendency range, suggesting some inclination toward dishonest strategies and moderate dissatisfaction with aspects of the digital environment.
example score
4/9
Need for Support in Teaching Activities (NfSiTA)
Measures how strongly an instructor feels they need additional support to teach effectively in the university’s digital learning environment.
Low need for support
Moderate need for support
High need for support
03: Low need for support | 46: Moderate need for support | 79: High need for support
A score of 4 indicates a moderate need for support, suggesting some dissatisfaction or challenges when using the digital environment for teaching.
example score
7/9
Stress During Instruction (SDI)
Measures the level of stress tension an instructor experiences while teaching in the university’s digital educational environment.
Low tension
Moderate tension
High tension
03: Low tension | 46: Moderate tension | 79: High tension
A score of 7 falls in the High tension range, indicating elevated stress tension while teaching in the digital educational environment.
example score
5/9
Interaction Satisfaction and Motivation (ISaM)
Measures the teacher’s satisfaction with communicative interaction and motivation for learning in the digital educational environment.
Low
Moderate
High
03: Low | 46: Moderate | 79: High
A score of 5 indicates a moderate level of satisfaction with interaction and a generally adequate, but not strongly positive, motivation to engage in the digital educational environment.
example score
3/9
Satisfaction With the Learning Process (SWtLP)
Measures the teacher’s satisfaction with the educational process and the perceived practical benefits of the digital learning environment.
Low satisfaction
Moderate satisfaction
High satisfaction
03: Low satisfaction | 46: Moderate satisfaction | 79: High satisfaction
A score of 3 indicates low satisfaction, suggesting the digital environment is currently seen as offering limited practical benefit for supporting the learning process.
example score
5/9
Digital Educational Environment Assessment (DEEA)
Measures an instructor’s overall satisfaction with and acceptance of the university’s digital educational environment.
Low acceptance
Moderate acceptance
High acceptance
03: Low acceptance | 46: Moderate acceptance | 79: High acceptance
A score of 5 indicates a moderate level of satisfaction and acceptance of the digital educational environment, with some aspects working well and others needing improvement.
Start Online Test
just completed the test
DATA-BASED USER COHORTS

Who Usually Takes This Test?

Faculty and lecturers
46%OF USERS
Instructors take it to rate how usable, supportive, and effective the university’s digital environment is for day-to-day teaching.
Newly hired instructors
32%OF USERS
New staff use it to quickly capture first impressions, pain points, and training needs when starting to teach digitally.
Course coordinators and leads
22%OF USERS
Teaching leaders take it to spot patterns across courses and prioritize improvements that help instructors work more smoothly.
BASED ON AGGREGATED, ANONYMIZED DATA FROM TENS OF THOUSANDS OF FREUDLY USERS.
Benchmarking

See How You Compare

Once you complete the test, your results are compared with real-world data from people in your country.
Below is a preview of how scores are typically distributed across each scale.
Accessibility (A)
Accessibility (A)
Average
3.9
Normal range
2.85
min.
0
max.
9
This curve shows how scores are typically distributed.
Once you complete the test, your result will appear on the scale so you can see how you compare.
Dishonest Strategies (DS)
Average
4.5
Normal range
3.15.9
min.
0
max.
9
This curve shows how scores are typically distributed.
Once you complete the test, your result will appear on the scale so you can see how you compare.
The Need for Support in Detention Centers (TNfSiDC)
Average
5.7
Normal range
4.17.2
min.
0
max.
9
This curve shows how scores are typically distributed.
Once you complete the test, your result will appear on the scale so you can see how you compare.
Stress Tension in Learning (STiL)
Average
4.5
Normal range
3.35.7
min.
0
max.
9
This curve shows how scores are typically distributed.
Once you complete the test, your result will appear on the scale so you can see how you compare.
Satisfaction with interaction and motivation (Swiam)
Average
6.1
Normal range
4.77.6
min.
0
max.
9
This curve shows how scores are typically distributed.
Once you complete the test, your result will appear on the scale so you can see how you compare.
Satisfied with the learning process (Swtlp)
Average
4.3
Normal range
2.85.8
min.
0
max.
9
This curve shows how scores are typically distributed.
Once you complete the test, your result will appear on the scale so you can see how you compare.
COS Rating Scale (CRS)
Average
6.7
Normal range
5.38.1
min.
0
max.
9
This curve shows how scores are typically distributed.
Once you complete the test, your result will appear on the scale so you can see how you compare.
Featured On
SAMPLE QUESTIONS

Example Questions From the Test

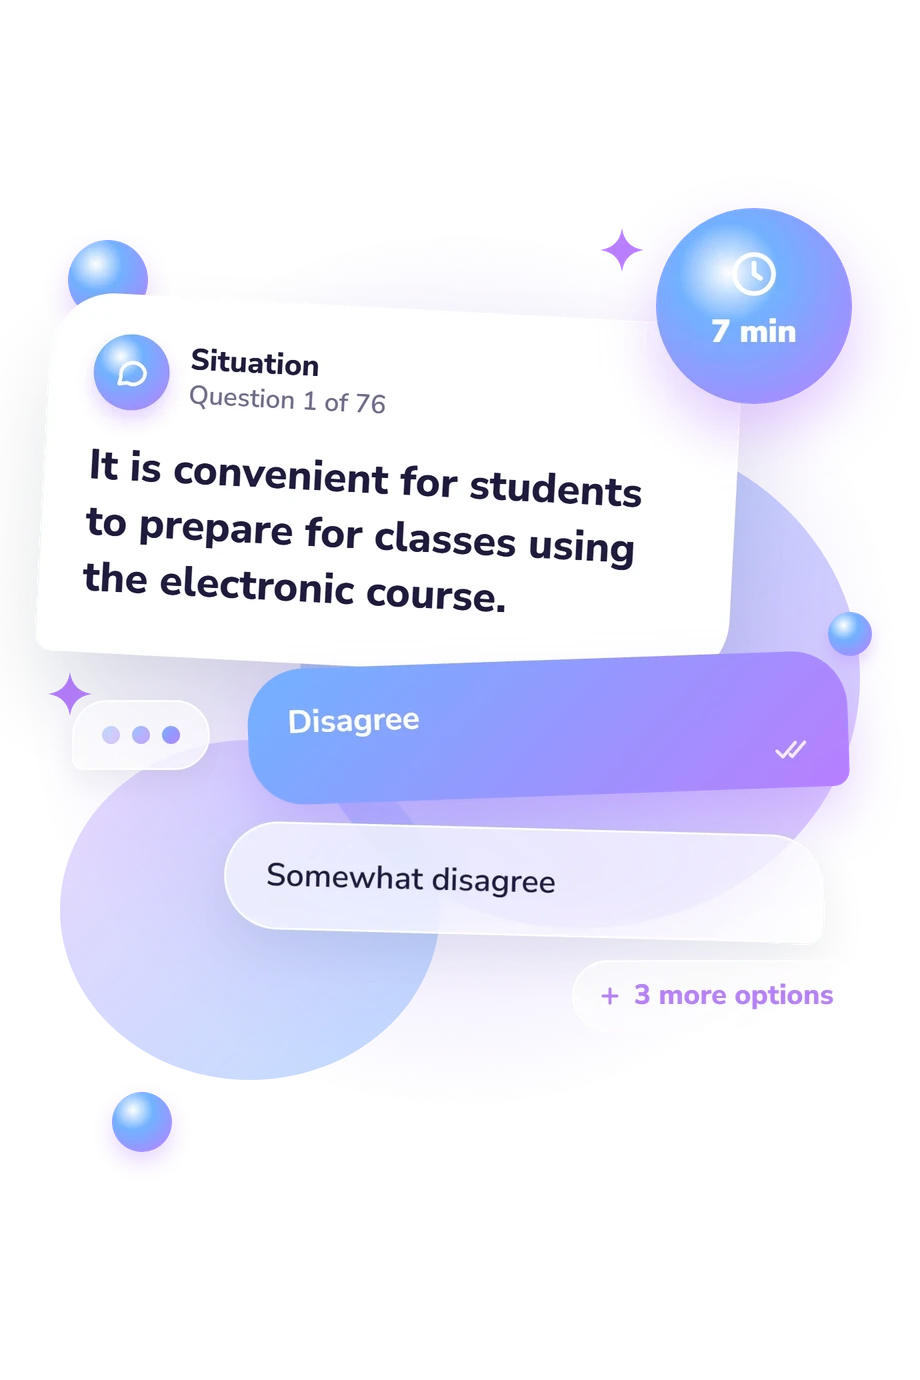
    • Disagree
    • Somewhat disagree
    • Unsure (neither agree nor disagree)
    • Somewhat agree
    • Agree
    • Disagree
    • Somewhat disagree
    • Not sure (neither agree nor disagree)
    • Somewhat agree
    • Agree
    • Disagree
    • Somewhat disagree
    • Not sure (neither agree nor disagree)
    • Somewhat agree
    • Agree
WHAT THE TEST MEASURES
About This Assessment
University COS Assessment Scale, AUDEE-Tch Test

University Digital Educational Environment Assessment Scale (AUDEE-Tch) Test - Symptoms and Signs

pedagogy

This instrument is designed to capture instructors’ perceptions of a university’s digital educational environment. The University Digital Educational Environment Assessment Scale (AUDEE-Tch) provides a structured way to evaluate how usable, supportive, and instructionally facilitative institutional digital platforms are from the faculty perspective.

The measure includes 38 items and typically requires about 7 minutes to complete. Items survey common domains of interaction with digital systems, such as perceived interface usability, functional adequacy, availability of support, and the extent to which the environment enables effective teaching and learning processes.

Results from the University Digital Educational Environment Assessment Scale (AUDEE-Tch) can be used to identify perceived strengths and implementation gaps in the digital environment, inform quality improvement efforts, and monitor change over time following platform updates or support interventions. The scale is attributed to T. Anderson, D. R. Garrison, and W. Archer.

Author: D. R. Garrison, T. Anderson, W. Archer
Literature: Davis, F. D. Perceived usefulness, perceived ease of use, and user acceptance of information technology. MIS Quarterly. 1989.
Popular tests
Comments
Leave a Comment