
Freudly+971 508685814hello@freudly.ai
Freudly
family adaptation

Family Adaptability and Cohesion Evaluation Scales III (FACES III) Test
Take the online Family Adaptability and Cohesion Evaluation Scales III (FACES III) Test - AI psychologist FreudlyYou can take Family Adaptability and Cohesion Evaluation Scales III (FACES III) Testhere. Online version of a simple and accurate psychological test with interpretation.en
Understand family closeness and flexibility under stress in about 8 minutes. Compare how things are now versus desired, to pinpoint strengths, gaps, and clear targets for therapy.
Start Online Test
Questions: 408 minutes
08:30
October 2, 2025
October 2, 2025
Material has been updated
October 2, 2025
Material has been published
31,499 views
3,566 completions
2,968 likes
Verified by Daniel Hall
Psychologist with 25 years of experience
Share
Scale Explorer

How the Scales are Structured

example score
2/10
Emotional Bonding Discrepancy (Ideal vs. Actual) (EBDvA)
Measures the gap between desired and current emotional closeness in the family, indicating how satisfied a person is with family cohesion.
Low gap
Moderate gap
High gap
03: Low gap | 46: Moderate gap | 710: High gap
A score of 2 indicates a low ideal–reality gap, suggesting the current emotional connection is close to what is desired.
example score
6/10
Rules (Ideal–Actual Discrepancy) (RAD)
Measures the size of the gap between how structured and stable family rules are in reality versus how they are ideally desired to be.
Low gap
Moderate gap
High gap
03: Low gap | 46: Moderate gap | 710: High gap
A score of 6 indicates a moderate discrepancy between desired and actual family rules, suggesting some dissatisfaction with how formalized or stable the norms feel.
example score
5/10
Roles (Ideal–Actual Discrepancy) (RAD)
Measures the gap between the family’s desired and actual distribution of roles and responsibilities.
Low mismatch
Moderate mismatch
High mismatch
03: Low mismatch | 46: Moderate mismatch | 710: High mismatch
A score of 5 indicates a moderate mismatch between preferred and current family roles, suggesting some dissatisfaction with how responsibilities are allocated.
example score
3/10
Discipline (Ideal-Actual Discrepancy) (DAD)
Measures the gap between how much discipline the family wants and how much discipline it experiences in everyday life.
Low gap
Moderate gap
High gap
03: Low gap | 46: Moderate gap | 710: High gap
A score of 3 indicates a low discrepancy between desired and actual family discipline, suggesting generally acceptable order and consistency with only minor unmet expectations.
example score
7/10
Control (Ideal-Real Discrepancy) (CRD)
Measures the gap between the family’s desired and current level of control and regulation in daily life.
Low gap
Moderate gap
High gap
03: Low gap | 46: Moderate gap | 710: High gap
A score of 7 indicates a high mismatch between desired and current family control, suggesting notable dissatisfaction with how regulated family life feels.
example score
7/10
Leadership (Ideal-Actual Discrepancy) (LAD)
Measures the size of the gap between desired and actual leadership (guidance and responsibility distribution) within the family.
Small gap
Moderate gap
Large gap
03: Small gap | 46: Moderate gap | 710: Large gap
A score of 7 indicates a large ideal-versus-reality gap in family leadership, suggesting notable dissatisfaction with how guidance or responsibilities are currently organized compared with what is desired.
example score
7/40
Family Adaptability Discrepancy (Ideal vs. Actual) (FADvA)
Measures the discrepancy between perceived current and desired family adaptability, indicating satisfaction with the family’s flexibility under stress.
Reality exceeds ideal
No gap
Ideal exceeds reality
-40-1: Reality exceeds ideal | 0: No gap | 140: Ideal exceeds reality
A score of 7 indicates a small-to-moderate gap where the desired level of family adaptability is higher than the current perception, suggesting some dissatisfaction with flexibility.
example score
3/10
Interests and Recreation (Ideal–Actual Discrepancy) (IaRAD)
Measures the size of the gap between desired and actual shared interests and leisure time in the family.
Low gap
Moderate gap
High gap
03: Low gap | 46: Moderate gap | 710: High gap
A score of 3 indicates a low gap, suggesting the family's current shared interests and leisure time are fairly close to what is desired.
example score
3/10
Friends (Ideal-Actual Discrepancy) (FAD)
Measures the gap between desired and actual family involvement in friendships, indicating how aligned social connectedness feels to the respondent.
Low discrepancy
Moderate discrepancy
High discrepancy
03: Low discrepancy | 46: Moderate discrepancy | 710: High discrepancy
A score of 3 suggests a low discrepancy between the desired and actual level of friendship involvement in the family, indicating generally aligned expectations.
example score
6/10
Time (Ideal-Actual Discrepancy) (TAD)
Measures the size of the gap between actual and desired time spent together as a family.
Small gap
Moderate gap
Large gap
03: Small gap | 46: Moderate gap | 710: Large gap
A score of 6 indicates a moderate discrepancy between current and preferred family time together, suggesting some dissatisfaction with this aspect of family life.
example score
5/10
Decision-Making (Ideal-Actual Discrepancy) (DMAD)
Measures how large the gap is between desired and actual involvement in family decision-making.
Low gap
Moderate gap
High gap
03: Low gap | 46: Moderate gap | 710: High gap
A score of 5 falls in the Moderate gap range, suggesting a noticeable mismatch between preferred and current participation in family decisions.
example score
8/10
Family Boundaries (Ideal-Actual Discrepancy) (FBAD)
Measures how large the gap is between desired and actual family boundaries and personal space.
Small gap
Moderate gap
Large gap
03: Small gap | 46: Moderate gap | 710: Large gap
A score of 8 indicates a large gap between ideal and current family boundaries, suggesting notable dissatisfaction with personal space or boundary clarity.
example score
18/40
Family Cohesion Discrepancy (Ideal vs. Actual) (FCDvA)
Measures the gap between ideal and current family cohesion, indicating how closely expectations about emotional closeness match perceived reality.
Reality > ideal cohesion
Aligned expectations
Ideal > reality cohesion
-40-1: Reality > ideal cohesion | 0: Aligned expectations | 140: Ideal > reality cohesion
A score of 18 indicates that the desired level of emotional closeness is notably higher than what is currently perceived, suggesting dissatisfaction with present family cohesion.
example score
9/10
Rules (R)
Rules measure how formalized, stable, and binding behavioral norms are within the family system.
Flexible
Balanced
Strict
03: Flexible | 47: Balanced | 810: Strict
A score of 9 suggests very strict, strongly enforced family rules that emphasize order and consistency but may limit flexibility under stress.
example score
6/10
Roles (R)
Roles measure how clearly and consistently responsibilities and family functions are distributed among members.
Unclear roles
Mostly defined roles
Well-defined roles
03: Unclear roles | 47: Mostly defined roles | 810: Well-defined roles
A score of 6 suggests that roles are generally allocated and understood, though some situations may still require clarification or renegotiation.
example score
3/10
Discipline (D)
Discipline measures how consistent, structured, and predictable family behavior and rules are in everyday life.
Low structure
Moderate structure
High structure
03: Low structure | 47: Moderate structure | 810: High structure
A score of 3 suggests low structure, with family routines and rules tending to be less consistent and predictable.
example score
4/10
Control (C)
Control reflects how strongly family members’ behavior is regulated by rules and expectations versus allowed to be spontaneous and free.
Low control
Moderate control
High control
03: Low control | 46: Moderate control | 710: High control
A score of 4 indicates moderate control, suggesting a balance between clear rules and room for flexibility and spontaneity in family interactions.
example score
4/10
Leadership (L)
Leadership measures how clearly guidance and responsibility are organized within the family system.
Low leadership
Moderate leadership
High leadership
03: Low leadership | 46: Moderate leadership | 710: High leadership
A score of 4 indicates moderate leadership, suggesting some guidance is present but roles and responsibility may not be consistently defined.
example score
18/50
Family Adaptability Level (FAL)
Assesses how flexibly a family system can adjust roles and rules to cope with change and stress.
Rigid
Balanced
Chaotic
1021: Rigid | 2230: Balanced | 3150: Chaotic
A score of 18 falls in the Rigid range, suggesting the family tends to respond to stress with limited flexibility and slower changes to established rules or roles.
example score
6/10
Interests and Recreation (IaR)
Measures the extent to which family members share common interests and spend leisure time together.
Disconnected leisure
Some shared interests
Strong shared leisure
03: Disconnected leisure | 47: Some shared interests | 810: Strong shared leisure
A score of 6 suggests the family has a moderate level of shared interests and leisure time, with connection present but not consistently maintained.
example score
3/10
Friends (F)
Measures how much the family is socially connected through friendships outside the family, from isolation to many shared friends.
Low involvement
Moderate involvement
High involvement
03: Low involvement | 47: Moderate involvement | 810: High involvement
A score of 3 suggests low family involvement in friendships outside the family, indicating relatively limited shared social connections.
example score
4/10
Time (T)
Assesses how much time family members spend together as an indicator of connectedness versus disconnection.
Low shared time
Moderate shared time
High shared time
03: Low shared time | 47: Moderate shared time | 810: High shared time
A score of 4 suggests a moderate level of shared family time, indicating some togetherness alongside noticeable periods of separation.
example score
7/10
Decision Making (DM)
Measures how much family members participate in shared discussion and collective decision-making.
Low shared decision-making
Moderate shared decision-making
High shared decision-making
03: Low shared decision-making | 47: Moderate shared decision-making | 810: High shared decision-making
A score of 7 suggests decisions are typically discussed together, though some choices may still be made independently by individual family members.
example score
2/10
Family Boundaries (FB)
Measures how clearly personal space and autonomy are separated among family members, reflecting the clarity of family boundaries.
Blurred boundaries
Moderately clear boundaries
Clear boundaries
03: Blurred boundaries | 47: Moderately clear boundaries | 810: Clear boundaries
A score of 2 falls in the “Blurred boundaries” range, suggesting relatively limited separation of personal space and autonomy among family members.
example score
6/10
Emotional Bonding (EB)
Emotional connection measures the degree of emotional closeness, mutual support, and attachment among family members.
Low connection
Moderate connection
High connection
03: Low connection | 47: Moderate connection | 810: High connection
A score of 6 indicates a moderate level of emotional closeness and support, suggesting connection is present while still allowing some interpersonal distance.
example score
34/50
Family Cohesion Level (FCL)
Measures the degree of emotional closeness and bonding among family members.
Lower cohesion
Connected
Very high cohesion
1036: Lower cohesion | 3742: Connected | 4350: Very high cohesion
A score of 34 falls in the Lower cohesion range, suggesting comparatively more emotional distance and autonomy among family members at present.
Start Online Test
just completed the test
DATA-BASED USER COHORTS

Who Usually Takes This Test?

Couples in relationship strain
41%OF USERS
Partners take it to understand emotional closeness, conflict patterns, and how flexibly their family system responds to stress.
Parents navigating transitions
34%OF USERS
Parents use it during major changes (new baby, divorce, relocation, adolescence) to see what needs to shift in roles and connection.
Family therapy and counseling clients
25%OF USERS
Families in counseling complete it to compare how things are versus how they want them to be and set clear therapy goals.
BASED ON AGGREGATED, ANONYMIZED DATA FROM TENS OF THOUSANDS OF FREUDLY USERS.
Benchmarking

See How You Compare

Once you complete the test, your results are compared with real-world data from people in your country.
Below is a preview of how scores are typically distributed across each scale.
Emotional Connection (the Ideal-Reality Gap) (EC(IG)
Average
3.2
Normal range
1.74.7
min.
0
max.
10
This curve shows how scores are typically distributed.
Once you complete the test, your result will appear on the scale so you can see how you compare.
Rules (Ideal vs. Reality Gap) (R(vRG)
Average
4.5
Normal range
2.96.2
min.
0
max.
10
This curve shows how scores are typically distributed.
Once you complete the test, your result will appear on the scale so you can see how you compare.
Roles (difference between ideal and reality) (R(biar)
Average
5
Normal range
3.56.4
min.
0
max.
10
This curve shows how scores are typically distributed.
Once you complete the test, your result will appear on the scale so you can see how you compare.
Discipline (gap between ideal and reality) (D(biar)
Average
6.9
Normal range
5.48.5
min.
0
max.
10
This curve shows how scores are typically distributed.
Once you complete the test, your result will appear on the scale so you can see how you compare.
Control (difference between ideal and reality) (C(biar)
Average
6.1
Normal range
4.67.5
min.
0
max.
10
This curve shows how scores are typically distributed.
Once you complete the test, your result will appear on the scale so you can see how you compare.
Leadership (Ideal vs. Reality Gap) (L(vRG)
Average
5.5
Normal range
46.9
min.
0
max.
10
This curve shows how scores are typically distributed.
Once you complete the test, your result will appear on the scale so you can see how you compare.
Family Adaptation (Ideal-Reality Gap) (FA(G)
Average
-10.8
Normal range
-21.60
min.
-40
max.
40
This curve shows how scores are typically distributed.
Once you complete the test, your result will appear on the scale so you can see how you compare.
Interests and Leisure (Ideal vs. Reality Gap) (IaL(vRG)
Average
3.5
Normal range
1.85.2
min.
0
max.
10
This curve shows how scores are typically distributed.
Once you complete the test, your result will appear on the scale so you can see how you compare.
Friends (the gap between ideal and reality) (F(gbiar)
Average
7.4
Normal range
5.89
min.
0
max.
10
This curve shows how scores are typically distributed.
Once you complete the test, your result will appear on the scale so you can see how you compare.
Time (difference between ideal and reality) (T(biar)
Average
5.2
Normal range
3.76.7
min.
0
max.
10
This curve shows how scores are typically distributed.
Once you complete the test, your result will appear on the scale so you can see how you compare.
Decision Making (The Gap Between Ideal and Reality) (DM(GBIaR)
Average
5.1
Normal range
3.76.6
min.
0
max.
10
This curve shows how scores are typically distributed.
Once you complete the test, your result will appear on the scale so you can see how you compare.
Family Boundaries (The Gap Between Ideal and Reality) (FB(GBIaR)
Average
7.3
Normal range
5.98.7
min.
0
max.
10
This curve shows how scores are typically distributed.
Once you complete the test, your result will appear on the scale so you can see how you compare.
Family cohesion (gap between ideal and reality) (Fc(biar)
Average
3.4
Normal range
-6.513.3
min.
-40
max.
40
This curve shows how scores are typically distributed.
Once you complete the test, your result will appear on the scale so you can see how you compare.
Rules (R)
Rules (R)
Average
6.4
Normal range
4.97.9
min.
0
max.
10
This curve shows how scores are typically distributed.
Once you complete the test, your result will appear on the scale so you can see how you compare.
Roles (R)
Roles (R)
Average
5.3
Normal range
3.96.6
min.
0
max.
10
This curve shows how scores are typically distributed.
Once you complete the test, your result will appear on the scale so you can see how you compare.
Discipline (D)
Discipline (D)
Average
7.2
Normal range
5.98.4
min.
0
max.
10
This curve shows how scores are typically distributed.
Once you complete the test, your result will appear on the scale so you can see how you compare.
Control (C)
Control (C)
Average
2.8
Normal range
1.54.1
min.
0
max.
10
This curve shows how scores are typically distributed.
Once you complete the test, your result will appear on the scale so you can see how you compare.
Leadership (L)
Leadership (L)
Average
3.8
Normal range
2.15.5
min.
0
max.
10
This curve shows how scores are typically distributed.
Once you complete the test, your result will appear on the scale so you can see how you compare.
Level of Family Adaptation (LoFA)
Average
27.8
Normal range
2233.6
min.
10
max.
50
This curve shows how scores are typically distributed.
Once you complete the test, your result will appear on the scale so you can see how you compare.
Interests and Leisure (IaL)
Average
7.1
Normal range
5.58.8
min.
0
max.
10
This curve shows how scores are typically distributed.
Once you complete the test, your result will appear on the scale so you can see how you compare.
Friends (F)
Friends (F)
Average
6
Normal range
4.17.9
min.
0
max.
10
This curve shows how scores are typically distributed.
Once you complete the test, your result will appear on the scale so you can see how you compare.
Time (T)
Time (T)
Average
5.3
Normal range
3.77
min.
0
max.
10
This curve shows how scores are typically distributed.
Once you complete the test, your result will appear on the scale so you can see how you compare.
Decision Making (DM)
Average
4.7
Normal range
3.36.1
min.
0
max.
10
This curve shows how scores are typically distributed.
Once you complete the test, your result will appear on the scale so you can see how you compare.
Family Boundaries (FB)
Average
3.9
Normal range
2.35.5
min.
0
max.
10
This curve shows how scores are typically distributed.
Once you complete the test, your result will appear on the scale so you can see how you compare.
Emotional connection (Ec)
Average
6.9
Normal range
5.48.4
min.
0
max.
10
This curve shows how scores are typically distributed.
Once you complete the test, your result will appear on the scale so you can see how you compare.
Level of Family Cohesion (LoFC)
Average
28.1
Normal range
22.333.9
min.
10
max.
50
This curve shows how scores are typically distributed.
Once you complete the test, your result will appear on the scale so you can see how you compare.
Featured On
SAMPLE QUESTIONS

Example Questions From the Test

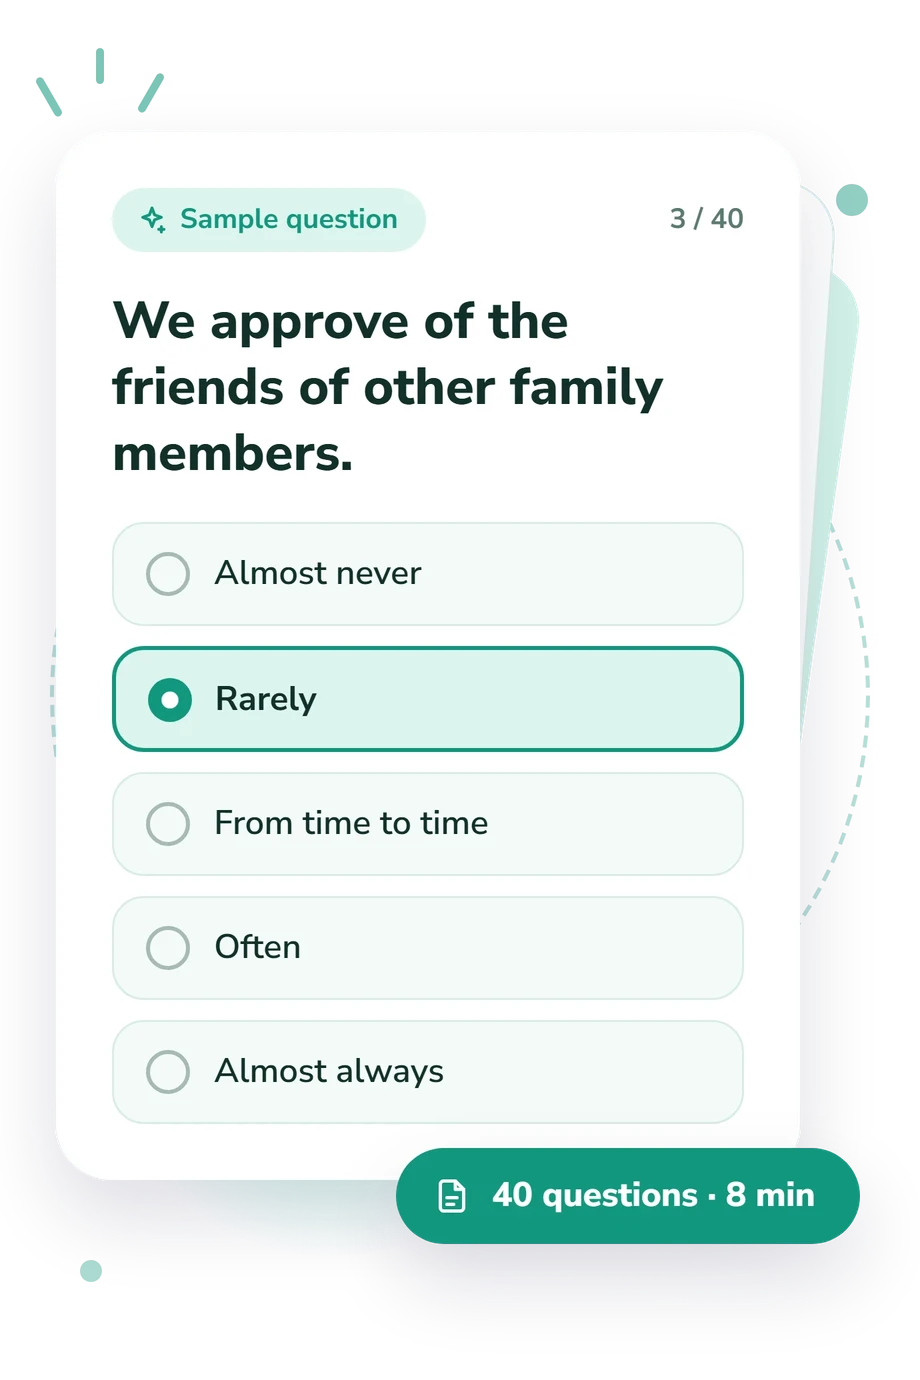
The questionnaire consists of two parts. First 20 items: Please describe your actual family (spouses, children). Read each statement and rate it using the scale provided. Next 20 items: Now, please describe the ideal family—the one you would wish for. Read each statement and rate it using the scale provided.
    • Almost never
    • Rarely
    • From time to time
    • Often
    • Almost always
    • Almost never
    • Rarely
    • From time to time
    • Often
    • Almost always
    • Almost never
    • Rarely
    • From time to time
    • Often
    • Almost always
WHAT THE TEST MEASURES
About This Assessment
Family Adaptability and Cohesion Scale, FACES III Test

Family Adaptability and Cohesion Evaluation Scales III (FACES III) Test - Symptoms and Signs

family adaptation
family

This measure is designed to support a brief assessment of family functioning, with emphasis on emotional bonding among family members and flexibility in response to stress. The Family Adaptability and Cohesion Evaluation Scales III (FACES III) provides a structured self-report format for describing the family system as currently perceived and as ideally desired.

The instrument includes 40 items and typically takes about 8 minutes to complete. It yields indices related to family cohesion and adaptability that can be used to inform clinical case conceptualization, treatment planning, and monitoring of change over time. The scale was developed by Yoav Lavee and Joyce Portner.

In clinical and research contexts, the Family Adaptability and Cohesion Evaluation Scales III (FACES III) is commonly used to characterize perceived strengths and areas of strain within family relationships, while recognizing that results should be interpreted alongside collateral information and the broader clinical presentation.

Author: David H. Olson, Joyce Portner, Yoav Lavee
Literature: Olson, D. H. Circumplex model of marital and family systems. Journal of Family Therapy. 2000.; Nichols, M. P. Family therapy: Concepts and methods. Pearson. 2009.
Popular tests
Comments
Leave a Comment